HOT TOPICS LIST
- MACD
- Fibonacci
- RSI
- Gann
- ADXR
- Stochastics
- Volume
- Triangles
- Futures
- Cycles
- Volatility
- ZIGZAG
- MESA
- Retracement
- Aroon
INDICATORS LIST
LIST OF TOPICS
PRINT THIS ARTICLE
by Jayanthi Gopalakrishnan
The Nasdaq composite has been playing the teasing game of late. It raises investors hopes by going up drastically for a few days only to be followed by declining values that shatter all hopes.
Position: N/A
Jayanthi Gopalakrishnan
PRINT THIS ARTICLE
That Pesky Nasdaq
10/27/00 02:11:51 PMby Jayanthi Gopalakrishnan
The Nasdaq composite has been playing the teasing game of late. It raises investors hopes by going up drastically for a few days only to be followed by declining values that shatter all hopes.
Position: N/A
| In situations like this what does an investor who is heavily dependent on the technology sector do? A glance at the daily chart will tell you that the index is in a definite trading range with no end in sight. |
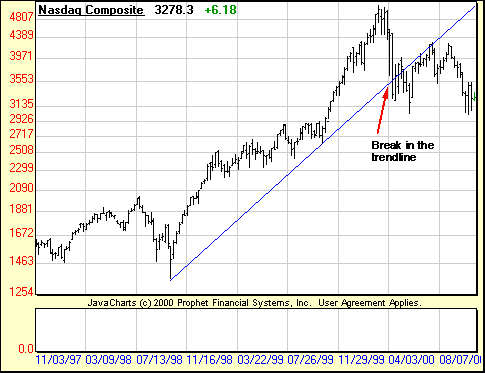
| Instead of focusing on the daily chart, bring up a weekly, or better yet, a monthly chart of the Nasdaq composite such as the one in the accompanying chart. You can easily see where the trendline was broken. For the Nasdaq to resume its uptrend, the prices will have to find their way above this trendline. At this point, it looks like it may be a while. |

|
| A monthly chart of the Nasdaq composite shows that the upward trend since July, 1998 was broken in early 2000. Only when the value goes above this line can you say the trend has resumed. |
| Graphic provided by: Prophet Financial Systems, Inc.. |
| |
| Title: | Editor |
| Company: | Technical Analysis of Stocks & Commodities |
| Address: | 4757 California Ave SW |
| Seattle, WA 98116 | |
| Website: | Traders.com |
| E-mail address: | Jayanthi@traders.com |
Traders' Resource Links | |
| Charting the Stock Market: The Wyckoff Method -- Books | |
| Working-Money.com -- Online Trading Services | |
| Traders.com Advantage -- Online Trading Services | |
| Technical Analysis of Stocks & Commodities -- Publications and Newsletters | |
| Working Money, at Working-Money.com -- Publications and Newsletters | |
| Traders.com Advantage -- Publications and Newsletters | |
| Professional Traders Starter Kit -- Software | |
Click here for more information about our publications!
Comments
Date: / /Rank: 4Comment:
Date: / /Rank: Comment: A couple of thoughts on this article. As everyone knows, the more points that prices touch a
trendline, the more important it becomes. Your article s trendline
touches the minimum required (2) before prices cross below it. This
would seem to say that perhaps this
trendline was not of great import.
If one were to draw a trendline roughly connecting the following dates:
2/15/99
3/1/99
5/24/99
8/9/99
10/16/00
one might see that this trendline has been touched (and repelled prices) 5 times, the most recent just a couple of weeks ago. Your trendline s angle was relatively steep, implying that it could soon be broken. The one I suggest is more gradual, has been contacted more times, and perhaps gives a truer picture of the current long term trend. If this is the case, then one should have been buying as prices dipped down around 10/16/00, while most others were jumping ship.
As one also knows, the more times a trendline (support) is tested,
the weaker it becomes. So perhaps
this is a last hurrah rally after
numerous times of being tested.
One could also draw a down trendline across the recent tops, with both creating a triangle. Perhaps we are in a large continuation pattern that will see much higher prices in the future. Or perhaps it will resove itself to the downside. Can t say.
I ve simply offered a different way to view the same data, not necessarily the way that will prove to be correct.
Thanks for the article. Keep up the good work!

Request Information From Our Sponsors
- StockCharts.com, Inc.
- Candle Patterns
- Candlestick Charting Explained
- Intermarket Technical Analysis
- John Murphy on Chart Analysis
- John Murphy's Chart Pattern Recognition
- John Murphy's Market Message
- MurphyExplainsMarketAnalysis-Intermarket Analysis
- MurphyExplainsMarketAnalysis-Visual Analysis
- StockCharts.com
- Technical Analysis of the Financial Markets
- The Visual Investor
- VectorVest, Inc.
- Executive Premier Workshop
- One-Day Options Course
- OptionsPro
- Retirement Income Workshop
- Sure-Fire Trading Systems (VectorVest, Inc.)
- Trading as a Business Workshop
- VectorVest 7 EOD
- VectorVest 7 RealTime/IntraDay
- VectorVest AutoTester
- VectorVest Educational Services
- VectorVest OnLine
- VectorVest Options Analyzer
- VectorVest ProGraphics v6.0
- VectorVest ProTrader 7
- VectorVest RealTime Derby Tool
- VectorVest Simulator
- VectorVest Variator
- VectorVest Watchdog
