HOT TOPICS LIST
- MACD
- Fibonacci
- RSI
- Gann
- ADXR
- Stochastics
- Volume
- Triangles
- Futures
- Cycles
- Volatility
- ZIGZAG
- MESA
- Retracement
- Aroon
INDICATORS LIST
LIST OF TOPICS
PRINT THIS ARTICLE
by David Penn
Negative divergences set up the 10-year note for a correction and possible test of the summer 2006 bottom.
Position: N/A
David Penn
Technical Writer for Technical Analysis of STOCKS & COMMODITIES magazine, Working-Money.com, and Traders.com Advantage.
PRINT THIS ARTICLE
BOND & INTEREST RATE
Will Bonds Test A Bottom?
01/08/07 12:42:02 PMby David Penn
Negative divergences set up the 10-year note for a correction and possible test of the summer 2006 bottom.
Position: N/A
| My last Traders.com Advantage article on long bonds (the 10-year Treasury note) was bullish ("A Cup With Handle For Treasury Notes," November 29, 2006). Based on the chart pattern highlighted in that article, I called for a move higher in the notes to at least the 110 level (basis March 2007) futures. |

|
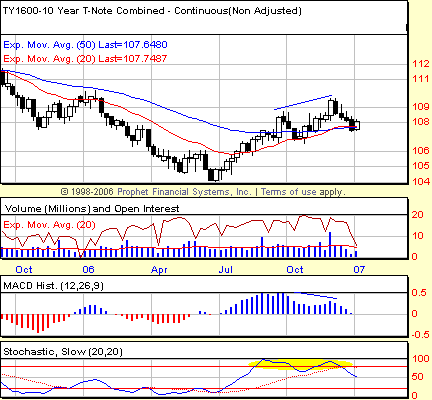
| FIGURE 1: 10-YEAR TREASURY NOTES, CONTINUOUS FUTURES, WEEKLY. Divergences in the weekly MACD histogram are often powerful indications of a market that will be making a change in trend. With a negative divergence in the MACD histogram confirmed by a negative divergence in the stochastic, the odds of a correction in the bond rally that began in the summer of 2006 are increasing. |
| Graphic provided by: Prophet Financial, Inc. |
| |
| As it turned out, the breakout from the cup with handle pattern fell short of that mark. Breaking out at about 108, the March Treasury note rallied to about 109.50 before pulling back and falling below the breakout level in mid-December. The pullback, so far, has found support at approximately the level of the low of the handle of the failed cup with handle pattern. |
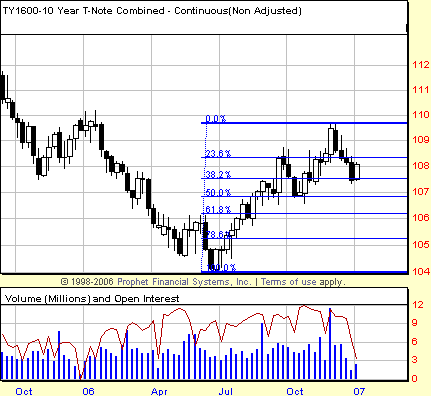
| Figure 1 shows what the failed breakout looked like in the larger context of the weekly chart. Here, it is clear that the failed breakout helped create a negative divergence with the moving average convergence/divergence (MACD) histogram and the stochastic. Although I pay somewhat less attention to the stochastic on weekly charts, seeing that indicator confirm the histogram makes me all the more convinced that the negative divergence will bring lower prices. There is long-term support in the form of 20- and 50-week exponential moving averages (EMAs) at current levels. And it wouldn't be surprising if those moving averages slowed the decline, possibly turning what could have been a sharper correction into perhaps more of a sideways one. But lower bond prices and higher bond yields look like the next step, based on the weekly chart in Figure 2. |

|
| FIGURE 2: 10-YEAR TREASURY NOTES, CONTINUOUS FUTURES, WEEKLY. This Fibonacci projection shows that the correction has found support at the 38.2% retracement level — at least for the time being. Next support lies at the 50% level just south of 107. |
| Graphic provided by: Prophet Financial, Inc. |
| |
| Assuming the support at the moving averages does not hold, what can investors expect in the way of downside in the 10-year Treasury note? There is an argument that a topping pattern developed from September through November (the same span as the failed cup with handle), and further that the topping pattern projects downward (in opposition to the upward projection initially based on a successful cup with handle breakout) two and a half points to the 104.5 area (basis continuous futures). |
| A correction of this magnitude would take the 10-year note tantalizingly close to the summer 2006 lows. From a longer-term perspective, this would be an ideal correction. One of the other points about the "A Cup With Handle For Treasury Notes" article from November was the long-term positive divergence in the MACD histogram — a positive divergence in the weekly chart that extends back to the summer of 2003 and appears to conclude with the lows of the summer of 2006. As such, I suspect that the 2006 low was the true low for the bear market in long bonds that began in 2003 and that a test of those "true lows" will be a key step in beginning any new bull market in bonds that may emerge from a successful test of the lows. |
Technical Writer for Technical Analysis of STOCKS & COMMODITIES magazine, Working-Money.com, and Traders.com Advantage.
| Title: | Technical Writer |
| Company: | Technical Analysis, Inc. |
| Address: | 4757 California Avenue SW |
| Seattle, WA 98116 | |
| Phone # for sales: | 206 938 0570 |
| Fax: | 206 938 1307 |
| Website: | www.Traders.com |
| E-mail address: | DPenn@traders.com |
Traders' Resource Links | |
| Charting the Stock Market: The Wyckoff Method -- Books | |
| Working-Money.com -- Online Trading Services | |
| Traders.com Advantage -- Online Trading Services | |
| Technical Analysis of Stocks & Commodities -- Publications and Newsletters | |
| Working Money, at Working-Money.com -- Publications and Newsletters | |
| Traders.com Advantage -- Publications and Newsletters | |
| Professional Traders Starter Kit -- Software | |
Click here for more information about our publications!
Comments
Date: 01/08/07Rank: 3Comment:

Request Information From Our Sponsors
- VectorVest, Inc.
- Executive Premier Workshop
- One-Day Options Course
- OptionsPro
- Retirement Income Workshop
- Sure-Fire Trading Systems (VectorVest, Inc.)
- Trading as a Business Workshop
- VectorVest 7 EOD
- VectorVest 7 RealTime/IntraDay
- VectorVest AutoTester
- VectorVest Educational Services
- VectorVest OnLine
- VectorVest Options Analyzer
- VectorVest ProGraphics v6.0
- VectorVest ProTrader 7
- VectorVest RealTime Derby Tool
- VectorVest Simulator
- VectorVest Variator
- VectorVest Watchdog
- StockCharts.com, Inc.
- Candle Patterns
- Candlestick Charting Explained
- Intermarket Technical Analysis
- John Murphy on Chart Analysis
- John Murphy's Chart Pattern Recognition
- John Murphy's Market Message
- MurphyExplainsMarketAnalysis-Intermarket Analysis
- MurphyExplainsMarketAnalysis-Visual Analysis
- StockCharts.com
- Technical Analysis of the Financial Markets
- The Visual Investor
