HOT TOPICS LIST
- MACD
- Fibonacci
- RSI
- Gann
- ADXR
- Stochastics
- Volume
- Triangles
- Futures
- Cycles
- Volatility
- ZIGZAG
- MESA
- Retracement
- Aroon
INDICATORS LIST
LIST OF TOPICS
PRINT THIS ARTICLE
by Arthur Hill
The Russell 2000 declined sharply over the past five days, and this key index is now trading at an important make-or-break level.
Position: Hold
Arthur Hill
Arthur Hill is currently editor of TDTrader.com, a website specializing in trading strategies, sector/industry specific breadth stats and overall technical analysis. He passed the Society of Technical Analysts (STA London) diploma exam with distinction is a Certified Financial Technician (CFTe). Prior to TD Trader, he was the Chief Technical Analyst for Stockcharts.com and the main contributor to the ChartSchool.
PRINT THIS ARTICLE
AROON
The Moment Of Truth For Small-Caps
01/08/07 10:36:02 AMby Arthur Hill
The Russell 2000 declined sharply over the past five days, and this key index is now trading at an important make-or-break level.
Position: Hold
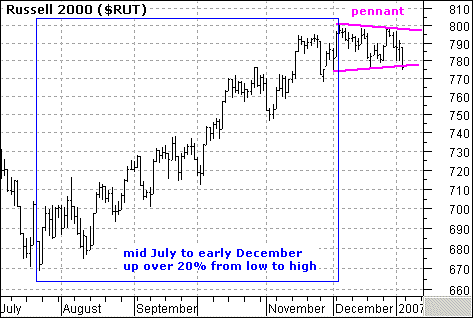
| First, let's review the price chart and the patterns at work (Figure 1). The index advanced from mid-July to early December 2006 and then consolidated over the last seven weeks. The advance gained over 20% from low to high and the consolidation represents a rest in the ongoing uptrend. |
| The consolidation narrowed in December, and the pattern since December 1 looks like a pennant. These are continuation patterns that are dependent on an upside breakout for confirmation. A move above 800 would break resistance and call for a continuation of the uptrend. Failure to break 800 and a break below pennant support at 775 would argue for a correction period. The index is already challenging the lower pennant trendline, and further weakness would be negative. |

|
| FIGURE 1: RUSSELL 2000. The index advanced from mid-July to early December and then consolidated over the last seven weeks. |
| Graphic provided by: MetaStock. |
| |
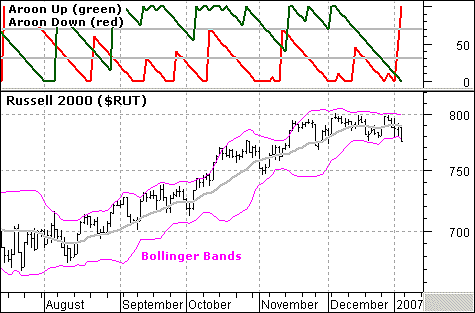
| Now let's look at two indicators to try and predict the direction of the breakout. The Bollinger Bands are overlaid on this price chart and these narrowed over the last few weeks (Figure 2). In fact, the bands are their narrowest in years and volatility contractions often precede breakouts. Bollinger Bands do not give us directional clues, but RUT broke below the lower band and this is negative. It is the first move below the lower band since June. |

|
| FIGURE 2: RUSSELL 2000. Predicting the direction of the breakout takes some doing. The Bollinger Bands are overlaid on the price chart and these narrowed over the last few weeks. |
| Graphic provided by: MetaStock. |
| |
| The Aroon indicators are shown in the top window. These cover 20 periods (one month) with red for Aroon down and green for Aroon up. Notice that Aroon down (red) remained below 70 from late July to early January. This pretty much covers the entire advance. In addition, Aroon up (green) held above 30 during this time period. The decline over the last few days changed all that as Aroon up moved below 30 on December 26 and Aroon down moved above 70. This shows weakness and favors a support break at 775. |
Arthur Hill is currently editor of TDTrader.com, a website specializing in trading strategies, sector/industry specific breadth stats and overall technical analysis. He passed the Society of Technical Analysts (STA London) diploma exam with distinction is a Certified Financial Technician (CFTe). Prior to TD Trader, he was the Chief Technical Analyst for Stockcharts.com and the main contributor to the ChartSchool.
| Title: | Editor |
| Company: | TDTrader.com |
| Address: | Willem Geetsstraat 17 |
| Mechelen, B2800 | |
| Phone # for sales: | 3215345465 |
| Website: | www.tdtrader.com |
| E-mail address: | arthurh@tdtrader.com |
Traders' Resource Links | |
| TDTrader.com has not added any product or service information to TRADERS' RESOURCE. | |
Click here for more information about our publications!
Comments
Date: 01/08/07Rank: 5Comment:
Date: 01/11/07Rank: 5Comment:

Request Information From Our Sponsors
- VectorVest, Inc.
- Executive Premier Workshop
- One-Day Options Course
- OptionsPro
- Retirement Income Workshop
- Sure-Fire Trading Systems (VectorVest, Inc.)
- Trading as a Business Workshop
- VectorVest 7 EOD
- VectorVest 7 RealTime/IntraDay
- VectorVest AutoTester
- VectorVest Educational Services
- VectorVest OnLine
- VectorVest Options Analyzer
- VectorVest ProGraphics v6.0
- VectorVest ProTrader 7
- VectorVest RealTime Derby Tool
- VectorVest Simulator
- VectorVest Variator
- VectorVest Watchdog
- StockCharts.com, Inc.
- Candle Patterns
- Candlestick Charting Explained
- Intermarket Technical Analysis
- John Murphy on Chart Analysis
- John Murphy's Chart Pattern Recognition
- John Murphy's Market Message
- MurphyExplainsMarketAnalysis-Intermarket Analysis
- MurphyExplainsMarketAnalysis-Visual Analysis
- StockCharts.com
- Technical Analysis of the Financial Markets
- The Visual Investor
