HOT TOPICS LIST
- MACD
- Fibonacci
- RSI
- Gann
- ADXR
- Stochastics
- Volume
- Triangles
- Futures
- Cycles
- Volatility
- ZIGZAG
- MESA
- Retracement
- Aroon
INDICATORS LIST
LIST OF TOPICS
PRINT THIS ARTICLE
by Koos van der Merwe
Is this stock one to look at or shy away from?
Position: Hold
Koos van der Merwe
Has been a technical analyst since 1969, and has worked as a futures and options trader with First Financial Futures in Johannesburg, South Africa.
PRINT THIS ARTICLE
TREND-CHANNEL
Is Seaspan Corp. A Stock To Look At?
01/05/07 02:22:46 PMby Koos van der Merwe
Is this stock one to look at or shy away from?
Position: Hold
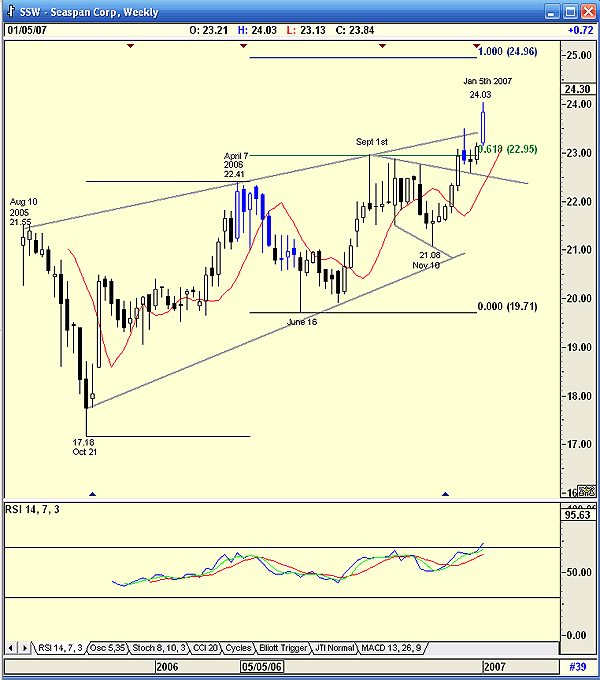
| Seaspan Corp. (SSW) started trading on August 10, 2005, reaching a high of $21.55 before falling to a low of $17.18 by October 21. From there, the stock price started climbing, reaching a high of $22.41 by April 7, 2006. From this high, the price fell once again to to a low of $19.71 on June 16. This allowed us to draw a Fibonacci extension as shown on Figure 1, with an immediate target of $22.95 (0.618), which was reached on September 1. The high of $22.95 also hit the trendline drawn from the two previous pivot points of August 10 and April 7. From this high — the high of September 1 — the price appeared to consolidate in a broadening formation, forming a low of $21.08 on November 10. Broadening formations are notoriously unpredictable, but with the relative strength index (RSI) pointing upward, the odds were that the price would rise, and it did reach a high of $24.03 by January 5, 2007, breaking above the resistance line in the process. What now for the future? To determine this, we now turn to a daily chart. |

|
| FIGURE 1: SEASPAN, WEEKLY. Broadening formations are notoriously unpredictable — what does the future hold for this stock? |
| Graphic provided by: AdvancedGET. |
| |
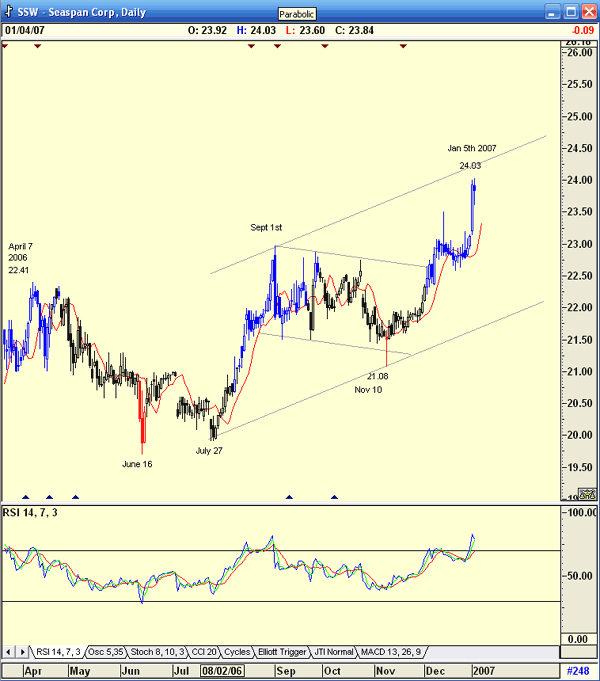
| I have drawn trendlines from July 27 to November 10 on Figure 2, with a parallel from the September 1st high. This does give us a target around about the $24.50 level. With an overbought RSI, this looks feasible. |

|
| FIGURE 2: SEASPAN, DAILY. With an overbought RSI, this stock looks feasible. |
| Graphic provided by: AdvancedGET. |
| |
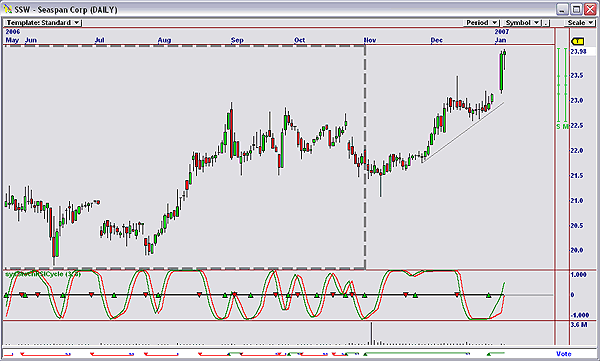
| To analyze farther, I then turn to a daily OmniTrader chart (Figure 3). I have programmed my parameters to give me sell signals based on a backtest hit rate over 250 days, and a forward test hit rate over 25 days. The program has been successful and gave me the latest buy signal on Thursday, December 28. I use an 8% stop-loss. As you can see, I would currently be long the stock and remain long until a stop-loss was hit, or the program suggested a short sell. |

|
| FIGURE 3: SEASPAN, DAILY. This chart shows buys and shorts. The chart also shows the backtest period used in the analysis. |
| Graphic provided by: OMNITRADER PROFESSIONAL. |
| |
| Trade well in this uncertain market. |
Has been a technical analyst since 1969, and has worked as a futures and options trader with First Financial Futures in Johannesburg, South Africa.
| Address: | 3256 West 24th Ave |
| Vancouver, BC | |
| Phone # for sales: | 6042634214 |
| E-mail address: | petroosp@gmail.com |
Click here for more information about our publications!
Comments
Date: 01/05/07Rank: 1Comment:

|

Request Information From Our Sponsors
- StockCharts.com, Inc.
- Candle Patterns
- Candlestick Charting Explained
- Intermarket Technical Analysis
- John Murphy on Chart Analysis
- John Murphy's Chart Pattern Recognition
- John Murphy's Market Message
- MurphyExplainsMarketAnalysis-Intermarket Analysis
- MurphyExplainsMarketAnalysis-Visual Analysis
- StockCharts.com
- Technical Analysis of the Financial Markets
- The Visual Investor
- VectorVest, Inc.
- Executive Premier Workshop
- One-Day Options Course
- OptionsPro
- Retirement Income Workshop
- Sure-Fire Trading Systems (VectorVest, Inc.)
- Trading as a Business Workshop
- VectorVest 7 EOD
- VectorVest 7 RealTime/IntraDay
- VectorVest AutoTester
- VectorVest Educational Services
- VectorVest OnLine
- VectorVest Options Analyzer
- VectorVest ProGraphics v6.0
- VectorVest ProTrader 7
- VectorVest RealTime Derby Tool
- VectorVest Simulator
- VectorVest Variator
- VectorVest Watchdog
