HOT TOPICS LIST
- MACD
- Fibonacci
- RSI
- Gann
- ADXR
- Stochastics
- Volume
- Triangles
- Futures
- Cycles
- Volatility
- ZIGZAG
- MESA
- Retracement
- Aroon
INDICATORS LIST
LIST OF TOPICS
PRINT THIS ARTICLE
by David Penn
A late October breakout leads to soaring coffee prices just in time for Christmas.
Position: N/A
David Penn
Technical Writer for Technical Analysis of STOCKS & COMMODITIES magazine, Working-Money.com, and Traders.com Advantage.
PRINT THIS ARTICLE
BREAKOUTS
Coffee Comes In
01/05/07 02:48:13 PMby David Penn
A late October breakout leads to soaring coffee prices just in time for Christmas.
Position: N/A
| When I last looked at coffee in October for Traders.com Advantage ("Is Coffee Creeping Lower?"), I was focused on the possibility of the commodity breaking down below a support level near $1.05 per pound. |

|
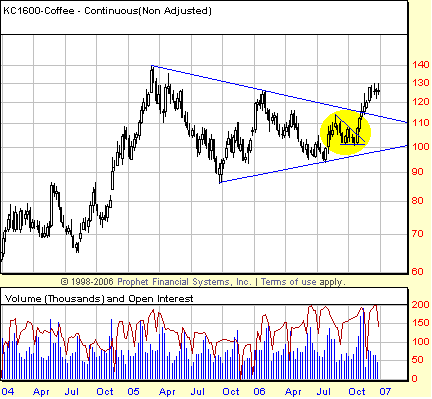
| FIGURE 1: COFFEE, BASIS CONTINUOUS FUTURES, WEEKLY. The descending triangle consolidation from which coffee broke free in October 2006 was a small part of a much larger triangle that extends back to the spring of 2005. |
| Graphic provided by: Prophet Financial, Inc. |
| |
| At the time, coffee futures had slipped into a descending triangular consolidation after falling from a recent high of more than $1.25 per pound at the beginning of 2006 (and an even higher high near $1.40 in March 2005) (Figure 1). My bet, on balance, was that coffee was likely to head lower, breaking down from the consolidation. "Should the support line not hold," I wrote, coffee futures could be headed to as low as 90 cents. |
| As it turned out, the support line did hold, and it was the declining trendline that helped form the descending triangle consolidation that did not. Coffee prices spiked dramatically higher mere days after my article on the topic and continued to move higher for the next 60 days. Dominick Mazza did an excellent job of analyzing and explaining the broader case for the bullishness of coffee in his article for Traders.com Advantage ("Coffee Break?") about 30 days into that rally. |

|
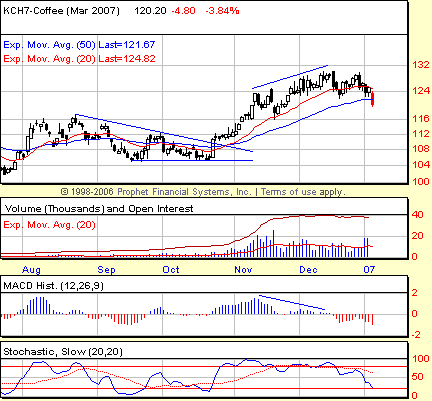
| FIGURE 2: COFFEE, MARCH FUTURES, DAILY. Negative divergences in the MACD histogram over the November–December period helped anticipate the developing correction in March 2007 coffee futures. |
| Graphic provided by: Prophet Financial, Inc. |
| |
| Something else that appeared about 30 days into the rally was the first sign that the move was running out of steam. By mid-December, the negative divergences that had been brewing in both the moving average convergence/divergence (MACD) histogram and the stochastic had become almost piping hot (Figure 2). Coffee moved sideways over the balance of December, but as the new year arrived, March coffee futures could be seen slipping below the December 2006 lows and severely testing the 50-day exponential moving average (EMA). |
| As of this writing, March coffee is stalled out at about the 38.2% retracement of the advance from the October lows. It would not be surprising at all if coffee spent more than a session at these levels as old shorts covered and new shorts climbed on board. The MACD histogram is suggesting that the current lows will not be the corrective lows insofar as that indicator is continuing to confirm the new lows of coffee with new lows of its own. Next support lies at 1.17, which is a 50% retracement level and, beyond that, 1.14 at the 61.8% retracement level. |
Technical Writer for Technical Analysis of STOCKS & COMMODITIES magazine, Working-Money.com, and Traders.com Advantage.
| Title: | Technical Writer |
| Company: | Technical Analysis, Inc. |
| Address: | 4757 California Avenue SW |
| Seattle, WA 98116 | |
| Phone # for sales: | 206 938 0570 |
| Fax: | 206 938 1307 |
| Website: | www.Traders.com |
| E-mail address: | DPenn@traders.com |
Traders' Resource Links | |
| Charting the Stock Market: The Wyckoff Method -- Books | |
| Working-Money.com -- Online Trading Services | |
| Traders.com Advantage -- Online Trading Services | |
| Technical Analysis of Stocks & Commodities -- Publications and Newsletters | |
| Working Money, at Working-Money.com -- Publications and Newsletters | |
| Traders.com Advantage -- Publications and Newsletters | |
| Professional Traders Starter Kit -- Software | |
Click here for more information about our publications!
Comments
Date: 01/05/07Rank: 2Comment:

Request Information From Our Sponsors
- StockCharts.com, Inc.
- Candle Patterns
- Candlestick Charting Explained
- Intermarket Technical Analysis
- John Murphy on Chart Analysis
- John Murphy's Chart Pattern Recognition
- John Murphy's Market Message
- MurphyExplainsMarketAnalysis-Intermarket Analysis
- MurphyExplainsMarketAnalysis-Visual Analysis
- StockCharts.com
- Technical Analysis of the Financial Markets
- The Visual Investor
- VectorVest, Inc.
- Executive Premier Workshop
- One-Day Options Course
- OptionsPro
- Retirement Income Workshop
- Sure-Fire Trading Systems (VectorVest, Inc.)
- Trading as a Business Workshop
- VectorVest 7 EOD
- VectorVest 7 RealTime/IntraDay
- VectorVest AutoTester
- VectorVest Educational Services
- VectorVest OnLine
- VectorVest Options Analyzer
- VectorVest ProGraphics v6.0
- VectorVest ProTrader 7
- VectorVest RealTime Derby Tool
- VectorVest Simulator
- VectorVest Variator
- VectorVest Watchdog
