HOT TOPICS LIST
- MACD
- Fibonacci
- RSI
- Gann
- ADXR
- Stochastics
- Volume
- Triangles
- Futures
- Cycles
- Volatility
- ZIGZAG
- MESA
- Retracement
- Aroon
INDICATORS LIST
LIST OF TOPICS
PRINT THIS ARTICLE
by David Penn
Negative divergences in the MACD histogram and stochastic anticipated the reversal in oil stocks.
Position: N/A
David Penn
Technical Writer for Technical Analysis of STOCKS & COMMODITIES magazine, Working-Money.com, and Traders.com Advantage.
PRINT THIS ARTICLE
REVERSAL
Crackin' Crude
01/04/07 09:39:11 AMby David Penn
Negative divergences in the MACD histogram and stochastic anticipated the reversal in oil stocks.
Position: N/A
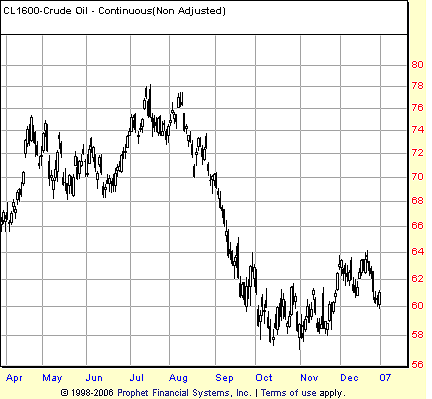
| Back in the summer of 2006, I wrote an article for Traders.com Advantage that suggested that lower crude oil prices were increasingly likely (see my "Cracks In The Crude" from July 25). At the time, crude oil was trading in the mid- to low 70s. But I warned that both weekly and daily charts of crude oil futures were hinting at weakness that anyone betting on higher oil prices needed to be aware of. Three months later, crude oil futures (basis continuous futures) were struggling to remain above $58. (See Figure 1.) |

|
| FIGURE 1: CRUDE OIL, CONTINUOUS FUTURES, DAILY. After trading in the high 70s in the summer of 2006, the price of crude oil futures collapsed over August and September before bottoming in October. |
| Graphic provided by: Prophet Financial, Inc. |
| |
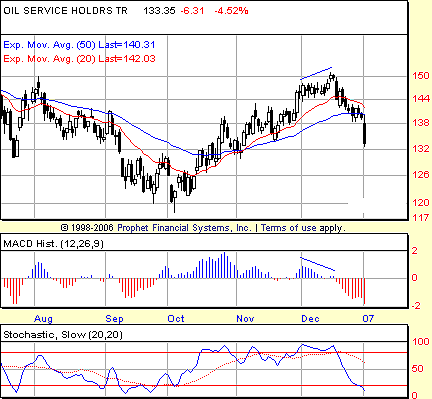
| Crude oil bottomed in October, and oil stocks in particular took the cue and began moving up sharply. Oil futures (basis continuous futures) were relatively modest in their October–December advance, rallying some 10%. But as measured by the oil service HOLDRS — which signaled the bottom with very clear-cut positive divergences in the stochastic and MACD histogram — oil stocks rallied some 25% from their October low to their peak in December. |
| As often is the case, however, the divergences that announce the beginning of a market move are often mirrored by divergences that anticipate the end of a market move. With oil service stocks (again, as measured by the OIH), negative divergences appeared by mid-December. It was December 18 when both the moving average convergence/divergence (MACD) histogram and stochastic completed lower highs, just as the OIH was coming down from a higher high. As far as oil bulls were concerned, December 18 might as well have been "Black (Gold) Monday," for the deluge had just begun. |

|
| FIGURE 2: OIL SERVICE HOLDRS, DAILY. Negative divergences in the MACD histogram and lower highs in the stochastic anticipated this correction in oil service stocks. The depth of the histogram suggests that the 132 level, at a minimum, will be broken before the correction has run its course. |
| Graphic provided by: Prophet Financial, Inc. |
| |
| The divergences provided for a short entry in the OIH near 141. If you look carefully, you can see that the decline stalled in this area for roughly three or four trading sessions before the big breakdown on January 3. And while there is likely to be some profit-taking given the speed and depth of the break, the size of the MACD histogram clearly points to further downside. For this reason, it may be wise to wait for a bounce — ideally up to the 138 level — before putting on a new short position vis-a-vis the OIH. |
| Where might the correction find support? The 132 area represents roughly a 61.8% retracement of the advance from the October closing low, so it would not be surprising if the bounce — in the guise of the forementioned profit-taking — comes sooner than later (see Figure 2). But if the OIH does not hold up at this level, traders should be prepared for a steeper decline to, perhaps, the 126 level. This level is potentially significant insofar as it matches up with both a swing rule projection downward from the December topping pattern (150 to 138 in height), as well as being near the 78.6% retracement level. |
Technical Writer for Technical Analysis of STOCKS & COMMODITIES magazine, Working-Money.com, and Traders.com Advantage.
| Title: | Technical Writer |
| Company: | Technical Analysis, Inc. |
| Address: | 4757 California Avenue SW |
| Seattle, WA 98116 | |
| Phone # for sales: | 206 938 0570 |
| Fax: | 206 938 1307 |
| Website: | www.Traders.com |
| E-mail address: | DPenn@traders.com |
Traders' Resource Links | |
| Charting the Stock Market: The Wyckoff Method -- Books | |
| Working-Money.com -- Online Trading Services | |
| Traders.com Advantage -- Online Trading Services | |
| Technical Analysis of Stocks & Commodities -- Publications and Newsletters | |
| Working Money, at Working-Money.com -- Publications and Newsletters | |
| Traders.com Advantage -- Publications and Newsletters | |
| Professional Traders Starter Kit -- Software | |
Click here for more information about our publications!
Comments
Date: 01/04/07Rank: 3Comment:

Request Information From Our Sponsors
- VectorVest, Inc.
- Executive Premier Workshop
- One-Day Options Course
- OptionsPro
- Retirement Income Workshop
- Sure-Fire Trading Systems (VectorVest, Inc.)
- Trading as a Business Workshop
- VectorVest 7 EOD
- VectorVest 7 RealTime/IntraDay
- VectorVest AutoTester
- VectorVest Educational Services
- VectorVest OnLine
- VectorVest Options Analyzer
- VectorVest ProGraphics v6.0
- VectorVest ProTrader 7
- VectorVest RealTime Derby Tool
- VectorVest Simulator
- VectorVest Variator
- VectorVest Watchdog
- StockCharts.com, Inc.
- Candle Patterns
- Candlestick Charting Explained
- Intermarket Technical Analysis
- John Murphy on Chart Analysis
- John Murphy's Chart Pattern Recognition
- John Murphy's Market Message
- MurphyExplainsMarketAnalysis-Intermarket Analysis
- MurphyExplainsMarketAnalysis-Visual Analysis
- StockCharts.com
- Technical Analysis of the Financial Markets
- The Visual Investor
