HOT TOPICS LIST
- MACD
- Fibonacci
- RSI
- Gann
- ADXR
- Stochastics
- Volume
- Triangles
- Futures
- Cycles
- Volatility
- ZIGZAG
- MESA
- Retracement
- Aroon
INDICATORS LIST
LIST OF TOPICS
PRINT THIS ARTICLE
by Gary Grosschadl
Dell Inc. stock peaked near $28 in late November and now has broken two support lines.
Position: Sell
Gary Grosschadl
Independent Canadian equities trader and technical analyst based in Peterborough
Ontario, Canada.
PRINT THIS ARTICLE
CHART ANALYSIS
Dell's Diminished Drive
01/02/07 09:52:41 AMby Gary Grosschadl
Dell Inc. stock peaked near $28 in late November and now has broken two support lines.
Position: Sell
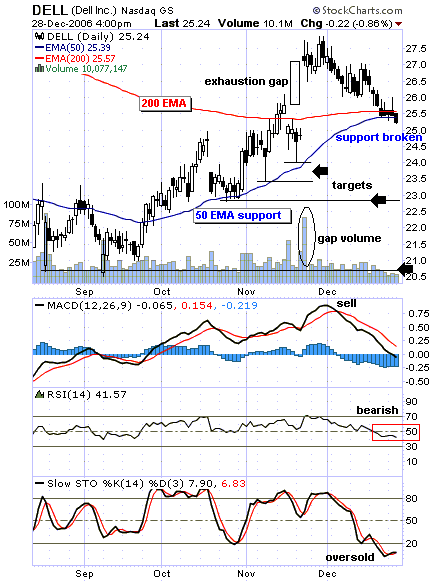
| Figure 1, a daily chart, shows a good upleg lasting three months, taking the stock from 20.50 to 28. It seems this drive is now in reverse. There were a couple of early warning signs for the alert trader. |
| The first hint of a possible topping-out was the large gap on exceptional volume around mid-November. After an extended rise or good upleg, gaps can hold a negative meaning, particularly when they occur with abnormally large volume. These are referred to as exhaustion gaps, as the bulls have exhausted their drive with this final leap higher. After an already sizable upleg coupled with a large gap, where will new bulls come from, especially when the abnormal volume surge is a one-day wonder? The second hint of a top comes with the moving average convergence divergence (MACD) sell signal, a crossover of its signal line. This could be seen as timely confirmation of the potential exhaustion gap. |

|
| FIGURE 1: DELL, DAILY. Continued downside is suggested here for Dell. |
| Graphic provided by: StockCharts.com. |
| |
| Now, further downside is indicated since two support lines have been violated. The 200-day exponential moving average (EMA) is a closely watched moving average, and traders often look to this level for possible support or resistance. With several recent closes below this line, a bounce off this line seems unlikely. The other moving average line (50-day EMA) is probably more significant due to a history of support. When a previous support level is broken, continued downside is often a no-brainer. The other thing to consider is that the refusal of the 50-day EMA to rise above the 200-day EMA averts an important trading signal that traders often target — the 50/200 EMA crossover. |
| Two other indicators are displayed. The relative strength index (RSI) shows a bearish move below its often key 50 support level. Meanwhile, the stochastic oscillator is a mixed blessing; being under the 20 level is considered an oversold condition, hinting at a possible approaching upleg or bounce attempt. However, most traders would not turn bullish here until the stochastic rises above the 20 level. |
| Bearing a sudden reversal and close above the 200-day EMA, several downside targets can be considered. These could be minor support at or near the bottoms of the previous long-tailed candlesticks between 23.50–24, or a previous support level near $23. Stronger support would be at or near the previous lows between 20–21. With these downside implications, the 50-day EMA becomes important overhead resistance, and moves to that line are potential bear rallies only. |
Independent Canadian equities trader and technical analyst based in Peterborough
Ontario, Canada.
| Website: | www.whatsonsale.ca/financial.html |
| E-mail address: | gwg7@sympatico.ca |
Click here for more information about our publications!
Comments
Date: 01/02/07Rank: 5Comment:

Request Information From Our Sponsors
- VectorVest, Inc.
- Executive Premier Workshop
- One-Day Options Course
- OptionsPro
- Retirement Income Workshop
- Sure-Fire Trading Systems (VectorVest, Inc.)
- Trading as a Business Workshop
- VectorVest 7 EOD
- VectorVest 7 RealTime/IntraDay
- VectorVest AutoTester
- VectorVest Educational Services
- VectorVest OnLine
- VectorVest Options Analyzer
- VectorVest ProGraphics v6.0
- VectorVest ProTrader 7
- VectorVest RealTime Derby Tool
- VectorVest Simulator
- VectorVest Variator
- VectorVest Watchdog
- StockCharts.com, Inc.
- Candle Patterns
- Candlestick Charting Explained
- Intermarket Technical Analysis
- John Murphy on Chart Analysis
- John Murphy's Chart Pattern Recognition
- John Murphy's Market Message
- MurphyExplainsMarketAnalysis-Intermarket Analysis
- MurphyExplainsMarketAnalysis-Visual Analysis
- StockCharts.com
- Technical Analysis of the Financial Markets
- The Visual Investor
