HOT TOPICS LIST
- MACD
- Fibonacci
- RSI
- Gann
- ADXR
- Stochastics
- Volume
- Triangles
- Futures
- Cycles
- Volatility
- ZIGZAG
- MESA
- Retracement
- Aroon
INDICATORS LIST
LIST OF TOPICS
PRINT THIS ARTICLE
by Gary Grosschadl
The stock price of General Motors has broken above a consolidation pattern, but can it track higher?
Position: Buy
Gary Grosschadl
Independent Canadian equities trader and technical analyst based in Peterborough
Ontario, Canada.
PRINT THIS ARTICLE
CHART ANALYSIS
GM Shifts To A Higher Gear
12/28/06 11:25:00 AMby Gary Grosschadl
The stock price of General Motors has broken above a consolidation pattern, but can it track higher?
Position: Buy
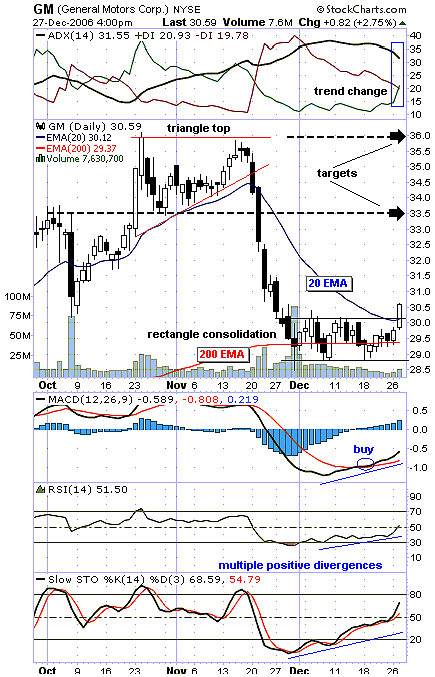
| As the Dow Jones Industrial Average (DJIA) has broken into new high territory nudging past 12,500, General Motors (GM) stock seems to have been inspired beyond its recent trading range. After a quick downleg from $36 to $28, a sideways consolidation ensued in the form of a month-long rectangle. The stock broke past this range on expanding but unexceptional volume, making it a little suspect. |
| Two moving averages are worth commenting on. The trading target for a downleg or retracement can often be at or near a significant moving average. Here we see the downleg was halted in the vicinity of the 200-day exponential moving average (EMA). The other moving average of note is the 20-day EMA. Stocks under bearish pressure often have the 20-period moving average as an overhead line of resistance. Often the next upleg is preceded or launched with a move past this line of resistance. This could be the case here. |

|
| FIGURE 1: GENERAL MOTORS, DAILY. This chart suggests a possible upleg for GM. |
| Graphic provided by: StockCharts.com. |
| |
| Several indicators are considered on Figure 1. The directional movement index (DMI) at the top shows a possible trend change. The average directional movement index (ADX) has peaked and begun to downslope, which often leads to a coming trend change. In this case with the positive directional indicator (+DI) crossing above its negative counterpart, a shift to bullish power is likely. The moving average convergence divergence (MACD) has given an early buy signal with its crossover of its signal line. Meanwhile, the relative strength index (RSI) shows a move past the often-key 50 level. The upslope of both lines hint at a growing trend. In addition, note the multiple positive divergences of the lower indicators to the price action. As the stock drifted sideways, these indicators were moving higher. This often precedes a move higher. |
| Should the stock price find some support above the 20-day EMA, then two upside targets are possible: the closest one $33 representing previous support and resistance, as well as the midpoint of a large candlestick. With more bullishness, the previous top near $36 comes into play. |
Independent Canadian equities trader and technical analyst based in Peterborough
Ontario, Canada.
| Website: | www.whatsonsale.ca/financial.html |
| E-mail address: | gwg7@sympatico.ca |
Click here for more information about our publications!
Comments
Date: 12/31/06Rank: 5Comment:
Date: 01/03/07Rank: 1Comment:

Request Information From Our Sponsors
- StockCharts.com, Inc.
- Candle Patterns
- Candlestick Charting Explained
- Intermarket Technical Analysis
- John Murphy on Chart Analysis
- John Murphy's Chart Pattern Recognition
- John Murphy's Market Message
- MurphyExplainsMarketAnalysis-Intermarket Analysis
- MurphyExplainsMarketAnalysis-Visual Analysis
- StockCharts.com
- Technical Analysis of the Financial Markets
- The Visual Investor
- VectorVest, Inc.
- Executive Premier Workshop
- One-Day Options Course
- OptionsPro
- Retirement Income Workshop
- Sure-Fire Trading Systems (VectorVest, Inc.)
- Trading as a Business Workshop
- VectorVest 7 EOD
- VectorVest 7 RealTime/IntraDay
- VectorVest AutoTester
- VectorVest Educational Services
- VectorVest OnLine
- VectorVest Options Analyzer
- VectorVest ProGraphics v6.0
- VectorVest ProTrader 7
- VectorVest RealTime Derby Tool
- VectorVest Simulator
- VectorVest Variator
- VectorVest Watchdog
