HOT TOPICS LIST
- MACD
- Fibonacci
- RSI
- Gann
- ADXR
- Stochastics
- Volume
- Triangles
- Futures
- Cycles
- Volatility
- ZIGZAG
- MESA
- Retracement
- Aroon
INDICATORS LIST
LIST OF TOPICS
PRINT THIS ARTICLE
by Gary Grosschadl
From humble beginnings in 1899, Dentsply International has grown to become the largest dental products company in the world. Where is it headed in the coming year?
Position: Sell
Gary Grosschadl
Independent Canadian equities trader and technical analyst based in Peterborough
Ontario, Canada.
PRINT THIS ARTICLE
SYMMETRICAL TRIANGLE
Examining XRAY
12/27/06 09:22:22 AMby Gary Grosschadl
From humble beginnings in 1899, Dentsply International has grown to become the largest dental products company in the world. Where is it headed in the coming year?
Position: Sell
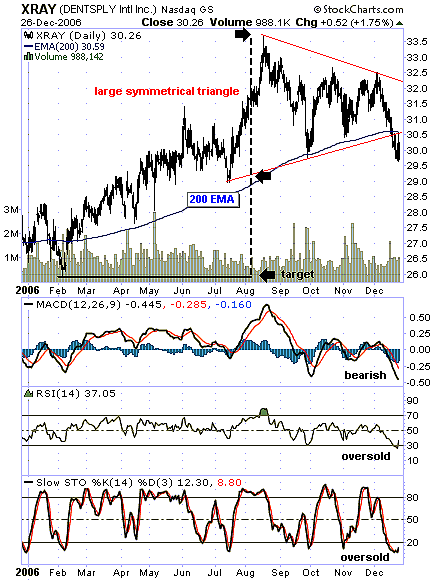
| Figure 1 showed a healthy increase in 2006, peaking in August at $33.50. Since then, Figure 1 shows a sideways drift but now may be tipping its hand via a distinguishable pattern. |
| The sideways drift takes the form of a large symmetrical triangle. This is considered a neutral pattern until it breaks either way. Recently, it broke under the lower trendline and now has come back to test this trendline. So far it has failed to rise above it and this has a bearish connotation, hinting at further downside. |

|
| FIGURE 1: XRAY, DAILY. This chart of Dentsply International shows a large pattern breakdown. |
| Graphic provided by: StockCharts.com. |
| |
| What makes this all the more significant is the placement of the 200-day exponential moving average (EMA). The EMA is more weighted to recent price action and so it is generally more sensitive than the simple moving average (SMA). I generally prefer the EMA to the SMA but when in doubt I go with the one that shows a better history of support or resistance. When a stock falls below this often-watched line in the sand, traders take note. Traders often abandon positions when 200-period EMA support is broken, as the same action can attract bearish traders assuming short positions. |
| Several indicators are examined. The moving average convergence/divergence (MACD) shows a bearish mode being downsloping and under the zero line. The relative strength index (RSI) shows an oversold condition with an uptick representing this stab higher in stock price. Meanwhile, the stochastic oscillator also shows an oversold position and may attempt an upleg from here. It needs to rise and hold above the 20 level to give any upleg attempt merit. |
| The downside target is assumed to be $26, as this represents a previous low from last February and is also the pattern completion target. When a symmetrical triangle breaks, the move either up or down can be a measured target equal to the widest part of the triangle. In this case, this would be a downside move roughly $4.50 (33.50 - 29) applied to the downside break below 30.50. This measured target therefore is 30.50 - 4.50 or $26. |
Independent Canadian equities trader and technical analyst based in Peterborough
Ontario, Canada.
| Website: | www.whatsonsale.ca/financial.html |
| E-mail address: | gwg7@sympatico.ca |
Click here for more information about our publications!
Comments
Date: 12/31/06Rank: 5Comment:

Request Information From Our Sponsors
- StockCharts.com, Inc.
- Candle Patterns
- Candlestick Charting Explained
- Intermarket Technical Analysis
- John Murphy on Chart Analysis
- John Murphy's Chart Pattern Recognition
- John Murphy's Market Message
- MurphyExplainsMarketAnalysis-Intermarket Analysis
- MurphyExplainsMarketAnalysis-Visual Analysis
- StockCharts.com
- Technical Analysis of the Financial Markets
- The Visual Investor
- VectorVest, Inc.
- Executive Premier Workshop
- One-Day Options Course
- OptionsPro
- Retirement Income Workshop
- Sure-Fire Trading Systems (VectorVest, Inc.)
- Trading as a Business Workshop
- VectorVest 7 EOD
- VectorVest 7 RealTime/IntraDay
- VectorVest AutoTester
- VectorVest Educational Services
- VectorVest OnLine
- VectorVest Options Analyzer
- VectorVest ProGraphics v6.0
- VectorVest ProTrader 7
- VectorVest RealTime Derby Tool
- VectorVest Simulator
- VectorVest Variator
- VectorVest Watchdog
