HOT TOPICS LIST
- MACD
- Fibonacci
- RSI
- Gann
- ADXR
- Stochastics
- Volume
- Triangles
- Futures
- Cycles
- Volatility
- ZIGZAG
- MESA
- Retracement
- Aroon
INDICATORS LIST
LIST OF TOPICS
PRINT THIS ARTICLE
by Gary Grosschadl
Has the Grinch stolen the Christmas rally, or is it already over for the NASDAQ?
Position: Sell
Gary Grosschadl
Independent Canadian equities trader and technical analyst based in Peterborough
Ontario, Canada.
PRINT THIS ARTICLE
CHART ANALYSIS
NASDAQ Composite Index Shows Pending Downleg
12/27/06 09:00:38 AMby Gary Grosschadl
Has the Grinch stolen the Christmas rally, or is it already over for the NASDAQ?
Position: Sell
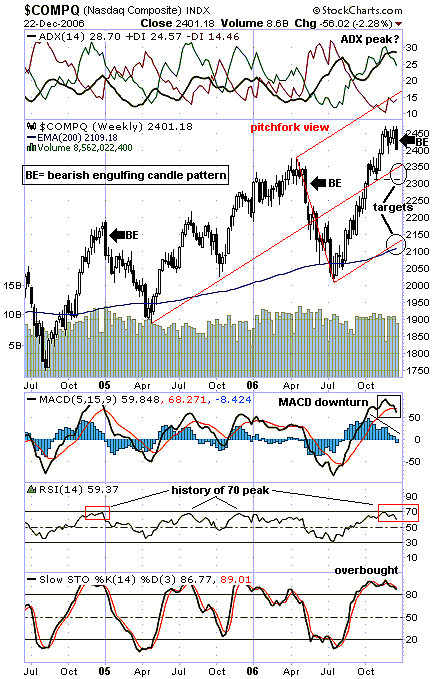
| It's been a good run for the high-tech index since the summer of 2004, as Figure 1 shows. This weekly chart shows a definite uptrend, and a pitchfork view or Andrews line highlights this. The good news is that an uptrend is in place, while the bad news is that a significant downleg may be in store affecting short-term and/or medium-term traders. |
| Note the history of bearish engulfing candlestick patterns marking sizable downlegs. These are large bearish candles that engulf the previous candlesticks. These can be reliable turning points after a good upleg. After the latest 450-point rise, another such bearish candlestick pattern has struck. |

|
| FIGURE 1: NASDAQ, WEEKLY. There's a definite uptrend, and a pitchfork view highlights that. |
| Graphic provided by: StockCharts.com. |
| |
| Several indicators hint at a coming downleg. The average directional movement index (ADX) line at the top of the chart may have peaked, as it is above the positive directional index (+DI) and it has flattened out. The moving average convergence/divergence (MACD) shows a downturn from peak levels, while its histogram shows a definite downtrend. The relative strength index (RSI) also seems to be coming off its own peak from the 70 level. Meanwhile, the stochastic oscillator hovers in an overbought condition but needs to decline below the 80 level to confirm a negative follow-through. |
| Two downside targets are possible. The first is a zone between 2300–2350 representing the median line of the pitchfork and a previous support point. The larger downside target is the lower pitchfork median line and the 200-period exponential moving average (EMA) near 2100. Watch these targets for another possible turnaround situation, should a downleg develop from the current position. |
Independent Canadian equities trader and technical analyst based in Peterborough
Ontario, Canada.
| Website: | www.whatsonsale.ca/financial.html |
| E-mail address: | gwg7@sympatico.ca |
Click here for more information about our publications!
Comments
Date: 12/31/06Rank: 5Comment:
Date: 01/02/07Rank: Comment: Gary used a MACD with 12-26 and another with 5-15?? Why the difference? I use a 12-26 and 6-13. Thanks for your logic.

Request Information From Our Sponsors
- StockCharts.com, Inc.
- Candle Patterns
- Candlestick Charting Explained
- Intermarket Technical Analysis
- John Murphy on Chart Analysis
- John Murphy's Chart Pattern Recognition
- John Murphy's Market Message
- MurphyExplainsMarketAnalysis-Intermarket Analysis
- MurphyExplainsMarketAnalysis-Visual Analysis
- StockCharts.com
- Technical Analysis of the Financial Markets
- The Visual Investor
- VectorVest, Inc.
- Executive Premier Workshop
- One-Day Options Course
- OptionsPro
- Retirement Income Workshop
- Sure-Fire Trading Systems (VectorVest, Inc.)
- Trading as a Business Workshop
- VectorVest 7 EOD
- VectorVest 7 RealTime/IntraDay
- VectorVest AutoTester
- VectorVest Educational Services
- VectorVest OnLine
- VectorVest Options Analyzer
- VectorVest ProGraphics v6.0
- VectorVest ProTrader 7
- VectorVest RealTime Derby Tool
- VectorVest Simulator
- VectorVest Variator
- VectorVest Watchdog
