HOT TOPICS LIST
- MACD
- Fibonacci
- RSI
- Gann
- ADXR
- Stochastics
- Volume
- Triangles
- Futures
- Cycles
- Volatility
- ZIGZAG
- MESA
- Retracement
- Aroon
INDICATORS LIST
LIST OF TOPICS
PRINT THIS ARTICLE
by David Penn
Bullish long-term, bearish intermediate term ... what does a near-term breakout mean for gold going forward?
Position: N/A
David Penn
Technical Writer for Technical Analysis of STOCKS & COMMODITIES magazine, Working-Money.com, and Traders.com Advantage.
PRINT THIS ARTICLE
GOLD & METALS
Gold's Three Trends
12/21/06 03:51:44 PMby David Penn
Bullish long-term, bearish intermediate term ... what does a near-term breakout mean for gold going forward?
Position: N/A
| Writing in their classic stock trading primer, Technical Analysis of Stock Trends, authors Robert D. Edwards and John Magee note that "the market, meaning the price of stocks in general," moves in three degrees of trend. As Dow theorists, Edwards and Magee refer to these three degrees as major or primary, secondary, and minor. Major or primary trends, per their classification, last at least one year and "may run for several years." Secondary trends run counter to the major or primary trend and tend to last "from three weeks to as many months, and rarely longer." Minor trends, which the authors suggest reflect the "day-to-day fluctuations which are unimportant," are of even shorter duration, "rarely as long as three weeks — usually less than six days." |

|
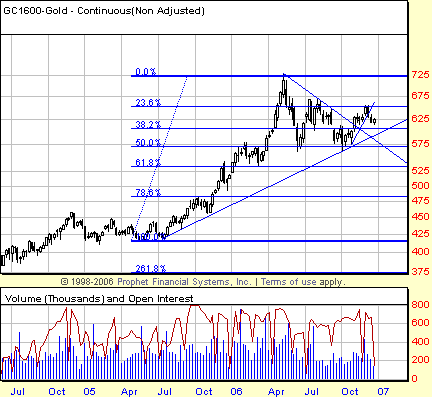
| FIGURE 1: GOLD, CONTINUOUS FUTURES, WEEKLY. Gold's primary or long-term uptrend was interrupted by a secondary or intermediate correction in the second half of 2006. That correction has retraced fully 50% of gold's advance from the lows of the summer of 2005. |
| Graphic provided by: Prophet Financial, Inc. |
| |
| Whether or not you subscribe to all aspects of these definitions, it is true that there are often multiple forces at work in a market and that these forces can often be classified as long, intermediate, and short term in duration. Looking at a three-year weekly chart of gold futures (Figure 1), for example, it is clear that what Edwards and Magee describe as the "tide, wave, and ripple" aspect of markets is very much in effect here. There is the primary, long-term tide in the form of a bull market in gold that began at least as early as August 2005. From May 2006 until October 2006, gold experienced a secondary or intermediate correction (a "wave," if you will) that retraced approximately 50% of the previous primary advance just mentioned. |
| The question for most gold watchers right now is what the advance from the October 2006 lows represents. Does it mark the end of the May–October correction and the resumption of the bull market that began in August 2005? Or is the rally simply a minor trend, a short-term movement within the intermediate correction, a short-term move that will end without setting a new high of any consequence and lead to an even deeper correction? |

|
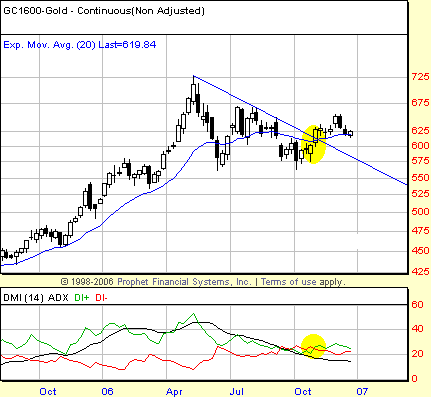
| FIGURE 2: GOLD, CONTINUOUS FUTURES, WEEKLY. Weekly directional movement suggests that gold is likely to head higher over the next few months, at least. Note how the crossover of the bullish DI+ line (in green) above the bearish DI- line (in red) coincides with prices breaking out above the downtrend line that extends down from the spring 2006 peak. |
| Graphic provided by: Prophet Financial, Inc. |
| |
| The weekly directional movement indicator acknowledges the likelihood of a significant low in October 2006 (Figure 2). We can tell this by the way the bullish DI+ line has crossed above the bearish DI- line at the beginning of November. The way that gold (basis continuous futures) found support at the 575 level — a level that was penetrated on an intraweek basis in June and again in October — also seems significant. The fact that gold has not yet closed beneath this area makes the 575 level a source of support to be monitored. It is also worth mentioning that the May–October correction at its lowest point retraced fully 50% of the previous advance. While a renewed correction could retrace even more, those long gold can at a minimum be assured that the correction was a significant one and that most of the "weak hands" had been shaken out. |
| There is a bearish case to be made. While directional movement on the weekly scale is bullish, there is not yet the sort of separation between DI+ and DI- that assures higher prices in the near term. In addition, the past few weeks have seen gold futures break down below a shorter-term, six-week trendline that extends from the late October lows. If higher gold prices are to arrive in the coming months, gold futures will have to rally above the most recent minor high just north of 650. Beyond that, the early July high of 669 lies ahead as another potential source of resistance. |
Technical Writer for Technical Analysis of STOCKS & COMMODITIES magazine, Working-Money.com, and Traders.com Advantage.
| Title: | Technical Writer |
| Company: | Technical Analysis, Inc. |
| Address: | 4757 California Avenue SW |
| Seattle, WA 98116 | |
| Phone # for sales: | 206 938 0570 |
| Fax: | 206 938 1307 |
| Website: | www.Traders.com |
| E-mail address: | DPenn@traders.com |
Traders' Resource Links | |
| Charting the Stock Market: The Wyckoff Method -- Books | |
| Working-Money.com -- Online Trading Services | |
| Traders.com Advantage -- Online Trading Services | |
| Technical Analysis of Stocks & Commodities -- Publications and Newsletters | |
| Working Money, at Working-Money.com -- Publications and Newsletters | |
| Traders.com Advantage -- Publications and Newsletters | |
| Professional Traders Starter Kit -- Software | |
Click here for more information about our publications!
Comments
Date: 12/21/06Rank: 3Comment:
Date: 01/03/07Rank: 5Comment: The essential indeterminancy which is found in predicting long-term trends for gold is well-illustrated in the article by Mr. Penn. Short-term, as in months, one can expect a probability of a decrease in price which exceeds the probability of an increase in that price to resistance at 725 or a nearer price-target of, say, 675. As always, Mr. Penn writes in a clearl and illustrative fashion which educates as well as alerts the reader.

Request Information From Our Sponsors
- StockCharts.com, Inc.
- Candle Patterns
- Candlestick Charting Explained
- Intermarket Technical Analysis
- John Murphy on Chart Analysis
- John Murphy's Chart Pattern Recognition
- John Murphy's Market Message
- MurphyExplainsMarketAnalysis-Intermarket Analysis
- MurphyExplainsMarketAnalysis-Visual Analysis
- StockCharts.com
- Technical Analysis of the Financial Markets
- The Visual Investor
- VectorVest, Inc.
- Executive Premier Workshop
- One-Day Options Course
- OptionsPro
- Retirement Income Workshop
- Sure-Fire Trading Systems (VectorVest, Inc.)
- Trading as a Business Workshop
- VectorVest 7 EOD
- VectorVest 7 RealTime/IntraDay
- VectorVest AutoTester
- VectorVest Educational Services
- VectorVest OnLine
- VectorVest Options Analyzer
- VectorVest ProGraphics v6.0
- VectorVest ProTrader 7
- VectorVest RealTime Derby Tool
- VectorVest Simulator
- VectorVest Variator
- VectorVest Watchdog
