HOT TOPICS LIST
- MACD
- Fibonacci
- RSI
- Gann
- ADXR
- Stochastics
- Volume
- Triangles
- Futures
- Cycles
- Volatility
- ZIGZAG
- MESA
- Retracement
- Aroon
INDICATORS LIST
LIST OF TOPICS
PRINT THIS ARTICLE
by Gary Grosschadl
After falling out of a near-$40 orbit early in 2005, this stock cratered down to $10 in the summer of 2006. Now it looks like another launch is under way.
Position: Buy
Gary Grosschadl
Independent Canadian equities trader and technical analyst based in Peterborough
Ontario, Canada.
PRINT THIS ARTICLE
REVERSAL
XMSR Satellite Radio Holdings Launching Off Bottom
12/21/06 02:38:13 PMby Gary Grosschadl
After falling out of a near-$40 orbit early in 2005, this stock cratered down to $10 in the summer of 2006. Now it looks like another launch is under way.
Position: Buy
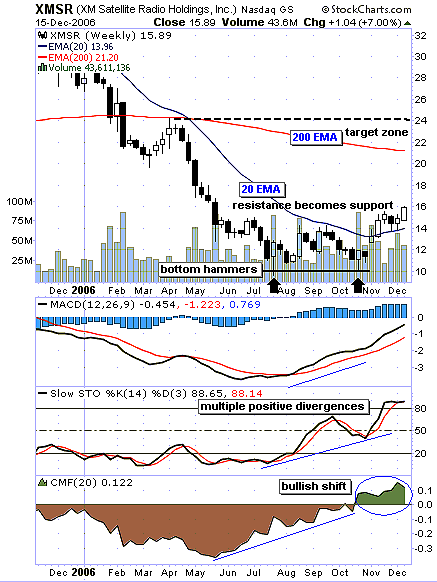
| Figure 1, a weekly chart of XMSR, shows a bottom attempt off two bottom hammer candlesticks from July and October 2006. Note the long decline of this stock while under the 20-day exponential moving average (EMA) resistance line. In early November, this resistance line was broken for the first time since the long decline began. This illustrates the principle of previous resistance becoming future support. As long as this 20-period EMA holds support, a trend change is in effect. |
| The three indicators below the price chart aptly foretell the coming rise off the second bottom hammer. Each of these indicators showed a positive divergence to price action. As the stock touched another bottom in November, these indicators went the other way and kept rising, hinting at a coming rise in the stock price. The moving average convergence/divergence (MACD) also showed an early buy signal with its bullish cross after the initial bottom. Note the Chaikin money flow (CMF) indicator shifted from bearish selling power to bullish buying power. |

|
| Graphic provided by: StockCharts.com. |
| |
| A target zone is surmised in the range between the 200-day EMA (currently 21.20) and $24. The 200-period EMA is an overhead resistance line that was previously respected with a shooting star candlestick last April. The $24 mark was the top of the previous bear rally. |
| In the longer term, should the stock successfully break the overhead 200-day EMA resistance (this may take several attempts), then a larger upleg could develop. This could signal a strong change in trend as stocks above the 200-period EMA (in any time frame) generally attract more bulls to the buy side. |
Independent Canadian equities trader and technical analyst based in Peterborough
Ontario, Canada.
| Website: | www.whatsonsale.ca/financial.html |
| E-mail address: | gwg7@sympatico.ca |
Click here for more information about our publications!
Comments
Date: 12/21/06Rank: 5Comment:
Date: 12/26/06Rank: 4Comment:

Request Information From Our Sponsors
- StockCharts.com, Inc.
- Candle Patterns
- Candlestick Charting Explained
- Intermarket Technical Analysis
- John Murphy on Chart Analysis
- John Murphy's Chart Pattern Recognition
- John Murphy's Market Message
- MurphyExplainsMarketAnalysis-Intermarket Analysis
- MurphyExplainsMarketAnalysis-Visual Analysis
- StockCharts.com
- Technical Analysis of the Financial Markets
- The Visual Investor
- VectorVest, Inc.
- Executive Premier Workshop
- One-Day Options Course
- OptionsPro
- Retirement Income Workshop
- Sure-Fire Trading Systems (VectorVest, Inc.)
- Trading as a Business Workshop
- VectorVest 7 EOD
- VectorVest 7 RealTime/IntraDay
- VectorVest AutoTester
- VectorVest Educational Services
- VectorVest OnLine
- VectorVest Options Analyzer
- VectorVest ProGraphics v6.0
- VectorVest ProTrader 7
- VectorVest RealTime Derby Tool
- VectorVest Simulator
- VectorVest Variator
- VectorVest Watchdog
