HOT TOPICS LIST
- MACD
- Fibonacci
- RSI
- Gann
- ADXR
- Stochastics
- Volume
- Triangles
- Futures
- Cycles
- Volatility
- ZIGZAG
- MESA
- Retracement
- Aroon
INDICATORS LIST
LIST OF TOPICS
PRINT THIS ARTICLE
by David Penn
Negative MACD histogram divergences and a breakdown from a consolidation suggest lower prices ahead.
Position: N/A
David Penn
Technical Writer for Technical Analysis of STOCKS & COMMODITIES magazine, Working-Money.com, and Traders.com Advantage.
PRINT THIS ARTICLE
REVERSAL
Transports Take A Hike
12/21/06 02:48:33 PMby David Penn
Negative MACD histogram divergences and a breakdown from a consolidation suggest lower prices ahead.
Position: N/A
| While the Dow Jones Industrial Average (DJIA) wades into all-time high territory, the Dow Jones Transportation Average (DJTA) has been decidedly less adventuresome in recent days and weeks. |

|
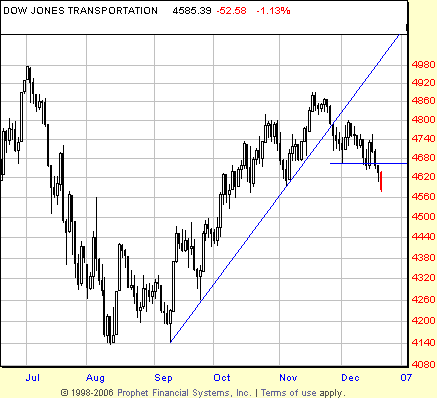
| FIGURE 1: DOW JONES TRANSPORTATION AVERAGE, DAILY. A failure of the 1-2-3 trend reversal test seems likely as the transports close below the post-trendline break low from December 1. The transports also appear to have been tracing out a head & shoulders top since late October. The potential downside from such a pattern would take the transports to as low as 4,380. |
| Graphic provided by: Prophet Financial, Inc. |
| |
| To be sure, the transports have already done their part for posterity, reaching new all-time highs back in late 2004 and breaking out above those levels "for good" almost one year later. But with a new all-time high in the transports set in June 2006, the index has arguably set the bar higher than even the highest-flying airline in the group can take it. (Incidentally, that "highest-flying airline" would most likely be Continental, which began 2006 in the low 20s and is currently trading in the low 40s.) |
| The transports, as shown in Figure 1, broke down below their main, intermediate-term trendline near the end of November. After a very short, post-break bounce, the transports resumed their movement lower, only recently closing below the low created by the trendline break. While it would have been clearer had the transports made more of an effort to set a new high for the intermediate-term advance after breaking the trendline, the new low that has been established suggests that the anemic bounce in early December anticipated the likely breakdown that would come a few trading days later. |

|
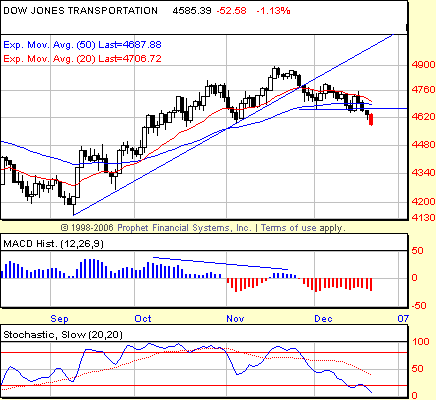
| FIGURE 2: DOW JONES TRANSPORTATION AVERAGE, DAILY. Negative divergences in both the stochastic and the MACD histogram suggested that the mid-November peak in the transports would likely lead to a correction of some significance. |
| Graphic provided by: Prophet Financial, Inc. |
| |
| Several days before the trendline break, however, the transports had begun showing signs of potential weakness. These signs came in the form of negative divergences in both the stochastic and the moving average convergence/divergence histogram. Negative divergences can be tantalizing, and traders need to be wary of believing that every negative divergence that appears is an unequivocal sell signal (Figure 2). One of the things I like about the BOSO approach I wrote about in Working-Money.com ("BOSO," October 5, 2005) is that it teaches me never to bet against an overbought stock. This little lesson is helpful in keeping me from chasing tops just because price has diverged from the indicator. As the saying goes, markets can remain irrational for longer than most investors and traders can remain solvent. Something similar is true about divergences. A correction or bounce of some sort almost always follows a divergence. But acting as if that correction or bounce is there before it really is there is a recipe for financial ruin. In other words, as long as you are on time, there is no reason to worry about trying to be early — the eternal temptation of the divergence trader. |
| In this instance, note the second peak in November, the peak that represents a higher high in price, but a lower high in both the stochastic and the MACD histogram. The negative divergence is clear as of November 20, when the lower highs in the indicators are formed. However, it isn't until November 28 when two things happen: (1) price breaks down below the trendline and (2) the transports slip from being "overbought." It is only after the market trades under the November 28 low — ideally on a closing basis — that I would feel comfortable betting against an advancing market that, as far as the 50-day exponential moving average (EMA) is concerned, is still advancing. Such a wager would have found a trader short transportation stocks on December 12. |
Technical Writer for Technical Analysis of STOCKS & COMMODITIES magazine, Working-Money.com, and Traders.com Advantage.
| Title: | Technical Writer |
| Company: | Technical Analysis, Inc. |
| Address: | 4757 California Avenue SW |
| Seattle, WA 98116 | |
| Phone # for sales: | 206 938 0570 |
| Fax: | 206 938 1307 |
| Website: | www.Traders.com |
| E-mail address: | DPenn@traders.com |
Traders' Resource Links | |
| Charting the Stock Market: The Wyckoff Method -- Books | |
| Working-Money.com -- Online Trading Services | |
| Traders.com Advantage -- Online Trading Services | |
| Technical Analysis of Stocks & Commodities -- Publications and Newsletters | |
| Working Money, at Working-Money.com -- Publications and Newsletters | |
| Traders.com Advantage -- Publications and Newsletters | |
| Professional Traders Starter Kit -- Software | |
Click here for more information about our publications!
Comments
Date: 12/21/06Rank: 3Comment:

Request Information From Our Sponsors
- VectorVest, Inc.
- Executive Premier Workshop
- One-Day Options Course
- OptionsPro
- Retirement Income Workshop
- Sure-Fire Trading Systems (VectorVest, Inc.)
- Trading as a Business Workshop
- VectorVest 7 EOD
- VectorVest 7 RealTime/IntraDay
- VectorVest AutoTester
- VectorVest Educational Services
- VectorVest OnLine
- VectorVest Options Analyzer
- VectorVest ProGraphics v6.0
- VectorVest ProTrader 7
- VectorVest RealTime Derby Tool
- VectorVest Simulator
- VectorVest Variator
- VectorVest Watchdog
- StockCharts.com, Inc.
- Candle Patterns
- Candlestick Charting Explained
- Intermarket Technical Analysis
- John Murphy on Chart Analysis
- John Murphy's Chart Pattern Recognition
- John Murphy's Market Message
- MurphyExplainsMarketAnalysis-Intermarket Analysis
- MurphyExplainsMarketAnalysis-Visual Analysis
- StockCharts.com
- Technical Analysis of the Financial Markets
- The Visual Investor
