HOT TOPICS LIST
- MACD
- Fibonacci
- RSI
- Gann
- ADXR
- Stochastics
- Volume
- Triangles
- Futures
- Cycles
- Volatility
- ZIGZAG
- MESA
- Retracement
- Aroon
INDICATORS LIST
LIST OF TOPICS
PRINT THIS ARTICLE
by Gary Grosschadl
Staples' price chart on a weekly basis has closed at a new all-time high. What transpires next should be a tradable move, but traders need to see some confirmation. Show us the money!
Position: Hold
Gary Grosschadl
Independent Canadian equities trader and technical analyst based in Peterborough
Ontario, Canada.
PRINT THIS ARTICLE
DOUBLE TOPS
Staples Ready To Make A Move?
12/19/06 10:34:12 AMby Gary Grosschadl
Staples' price chart on a weekly basis has closed at a new all-time high. What transpires next should be a tradable move, but traders need to see some confirmation. Show us the money!
Position: Hold
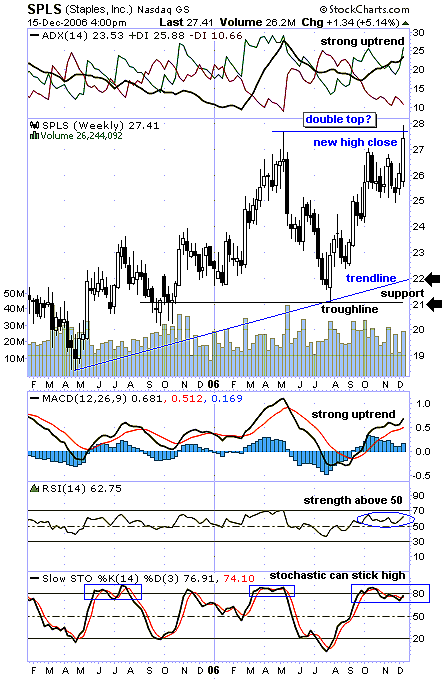
| This weekly chart (Figure 1) looks healthy, as the uptrend is obvious. However, my pattern trader's Spidey sense is tingling with doubt. Part of me tells me to look at this stock, which is busting into new high territory with some promising indicators. Another part of me says this pattern looks too familiar for a possible downside move. |
| The proof is in the pudding, so the next move bears watching (is that a Freudian slip?). Let's assume a bullish camp for now. The stock closed on a new all-time high and several indicators look healthy for continued upside. At the top of the chart, the three components of the directional movement index (DMI) show a bullish stance. The average directional movement index (ADX) is upsloping above 20 while between the positive and negative directional indicators. This indicates the presence of a strong and rising trend. The moving average convergence/divergence (MACD) is hinting a similar bullish stance with its own upsloping move above the zero line. The relative strength index (RSI) is holding strength above its often crucial 50 level. Meanwhile, the stochastic oscillator shows a possible thwarted downleg from a move below the overbought zone of above the 80 level. Typically in a nontrending environment, this oscillator heads down soon after peaking. When a strong uptrend is in place, however, this oscillator can stay overbought for a longer period. |

|
| FIGURE 1: SPLS, WEEKLY. This chart looks promising but in reality can go either way. |
| Graphic provided by: StockCharts.com. |
| |
| The bearish part of my brain says this pattern looks all too familiar. Consider this to be the start of a large ascending triangle pattern, where the top and bottom trendlines can be tested several times before a convincing break either way transpires. Note the bottom trendline near $22. Further, the symmetry or look of the chart pattern holds the possibility of a double top. A trendline has been established at the last reversal point near $21, suggesting two downside possibilities: First, a test of this trendline (should the stock price head down) and then a bigger downside move should the trendline fail to hold support. Technically, the double top is confirmed with a downside break. The measured downside move would then be the distance from the double top to the trendline being applied to the move below this same line. That is roughly seven points, which would have a completion target of $14 (21 - 7). In summary, the downside has two potential targets: support at or near the trendline area of $21–22 or the pattern completion target at or near $14. |
| So now it's "Show me the money" time, either a sustained break above the top trendline or a downside move via at least a double top attempt that may or may not be rescued near the support zone of $21–22. |
Independent Canadian equities trader and technical analyst based in Peterborough
Ontario, Canada.
| Website: | www.whatsonsale.ca/financial.html |
| E-mail address: | gwg7@sympatico.ca |
Click here for more information about our publications!
Comments
Date: 12/19/06Rank: 5Comment:
Date: 12/26/06Rank: 5Comment:

|

Request Information From Our Sponsors
- VectorVest, Inc.
- Executive Premier Workshop
- One-Day Options Course
- OptionsPro
- Retirement Income Workshop
- Sure-Fire Trading Systems (VectorVest, Inc.)
- Trading as a Business Workshop
- VectorVest 7 EOD
- VectorVest 7 RealTime/IntraDay
- VectorVest AutoTester
- VectorVest Educational Services
- VectorVest OnLine
- VectorVest Options Analyzer
- VectorVest ProGraphics v6.0
- VectorVest ProTrader 7
- VectorVest RealTime Derby Tool
- VectorVest Simulator
- VectorVest Variator
- VectorVest Watchdog
- StockCharts.com, Inc.
- Candle Patterns
- Candlestick Charting Explained
- Intermarket Technical Analysis
- John Murphy on Chart Analysis
- John Murphy's Chart Pattern Recognition
- John Murphy's Market Message
- MurphyExplainsMarketAnalysis-Intermarket Analysis
- MurphyExplainsMarketAnalysis-Visual Analysis
- StockCharts.com
- Technical Analysis of the Financial Markets
- The Visual Investor
