HOT TOPICS LIST
- MACD
- Fibonacci
- RSI
- Gann
- ADXR
- Stochastics
- Volume
- Triangles
- Futures
- Cycles
- Volatility
- ZIGZAG
- MESA
- Retracement
- Aroon
INDICATORS LIST
LIST OF TOPICS
PRINT THIS ARTICLE
by Arthur Hill
The S&P Small-Cap iShares has been underperforming the S&P 500 this month, and a bearish candlestick reversal points to more weakness.
Position: Sell
Arthur Hill
Arthur Hill is currently editor of TDTrader.com, a website specializing in trading strategies, sector/industry specific breadth stats and overall technical analysis. He passed the Society of Technical Analysts (STA London) diploma exam with distinction is a Certified Financial Technician (CFTe). Prior to TD Trader, he was the Chief Technical Analyst for Stockcharts.com and the main contributor to the ChartSchool.
PRINT THIS ARTICLE
CANDLESTICK CHARTING
Small Caps Show Relative Weakness
12/19/06 09:58:05 AMby Arthur Hill
The S&P Small-Cap iShares has been underperforming the S&P 500 this month, and a bearish candlestick reversal points to more weakness.
Position: Sell
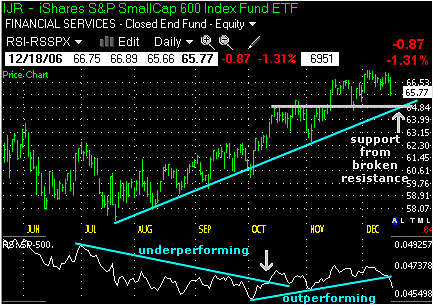
| The S&P Small-Cap iShares (IJR) remains in a medium-term uptrend, but relative weakness over the last few weeks could foreshadow a trend reversal. IJR remains with a series of higher highs and higher lower over the last few months. This is the definition of an uptrend, and the exchange traded fund (ETF) has yet to break the July trendline. This trendline converges with broken resistance to mark support around 65. A move below the November low (64.62) would forge a lower low, and this would mark the beginnings of a medium-term trend change. See Figure 1. |

|
| FIGURE 1: IJR, DAILY. This ETF remains in a medium-term uptrend, but relative weakness could foreshadow a trend reversal. |
| Graphic provided by: TC2000.com. |
| Graphic provided by: Telechart 2007. |
| |
| The ETF formed a higher high in early December, but the price relative formed a lower high and this shows relative weakness. The price relative compares the performance of IJR (small-caps) to the Standard & Poor's 500 (large-caps). The line rises when IJR outperforms and falls when IJR underperforms. The price relative broke trendline resistance in October to start a period of outperformance (gray arrow). The price relative formed lower high in December and then broke below its late November low this week. Small-caps are now showing relative weakness, and that is not a good sign. |

|
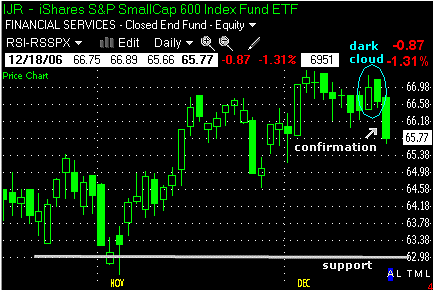
| FIGURE 2: IJR, DAILY. A confirmed candlestick reversal points to further weakness ahead. |
| Graphic provided by: TC2000.com. |
| Graphic provided by: Telechart 2007. |
| |
| A recent bearish candlestick reversal pattern points to further weakness, and I do not think support at 65 will hold. The ETF formed a dark cloud pattern on Thursday and Friday, December 14 and 15 (Figure 2). This occurs when the open is above the prior close and the close is below the midpoint of the prior candlesticks body. IJR opened strong on Friday but closed weak and this is a reversal day. A long black candlestick followed and this confirms the pattern. A confirmed candlestick reversal points to further weakness ahead and I would expect a support test around 63. This support level is marked by the late October and early November lows. |
Arthur Hill is currently editor of TDTrader.com, a website specializing in trading strategies, sector/industry specific breadth stats and overall technical analysis. He passed the Society of Technical Analysts (STA London) diploma exam with distinction is a Certified Financial Technician (CFTe). Prior to TD Trader, he was the Chief Technical Analyst for Stockcharts.com and the main contributor to the ChartSchool.
| Title: | Editor |
| Company: | TDTrader.com |
| Address: | Willem Geetsstraat 17 |
| Mechelen, B2800 | |
| Phone # for sales: | 3215345465 |
| Website: | www.tdtrader.com |
| E-mail address: | arthurh@tdtrader.com |
Traders' Resource Links | |
| TDTrader.com has not added any product or service information to TRADERS' RESOURCE. | |
Click here for more information about our publications!
Comments
Date: 12/19/06Rank: 4Comment:

Request Information From Our Sponsors
- StockCharts.com, Inc.
- Candle Patterns
- Candlestick Charting Explained
- Intermarket Technical Analysis
- John Murphy on Chart Analysis
- John Murphy's Chart Pattern Recognition
- John Murphy's Market Message
- MurphyExplainsMarketAnalysis-Intermarket Analysis
- MurphyExplainsMarketAnalysis-Visual Analysis
- StockCharts.com
- Technical Analysis of the Financial Markets
- The Visual Investor
- VectorVest, Inc.
- Executive Premier Workshop
- One-Day Options Course
- OptionsPro
- Retirement Income Workshop
- Sure-Fire Trading Systems (VectorVest, Inc.)
- Trading as a Business Workshop
- VectorVest 7 EOD
- VectorVest 7 RealTime/IntraDay
- VectorVest AutoTester
- VectorVest Educational Services
- VectorVest OnLine
- VectorVest Options Analyzer
- VectorVest ProGraphics v6.0
- VectorVest ProTrader 7
- VectorVest RealTime Derby Tool
- VectorVest Simulator
- VectorVest Variator
- VectorVest Watchdog
