HOT TOPICS LIST
- MACD
- Fibonacci
- RSI
- Gann
- ADXR
- Stochastics
- Volume
- Triangles
- Futures
- Cycles
- Volatility
- ZIGZAG
- MESA
- Retracement
- Aroon
INDICATORS LIST
LIST OF TOPICS
PRINT THIS ARTICLE
by Gary Grosschadl
eBay has come off a summer bottom for a nice gain, but what's it got in store now?
Position: Hold
Gary Grosschadl
Independent Canadian equities trader and technical analyst based in Peterborough
Ontario, Canada.
PRINT THIS ARTICLE
RESISTANCE LINE
eBay Tests Overhead Resistance
12/18/06 09:00:32 AMby Gary Grosschadl
eBay has come off a summer bottom for a nice gain, but what's it got in store now?
Position: Hold
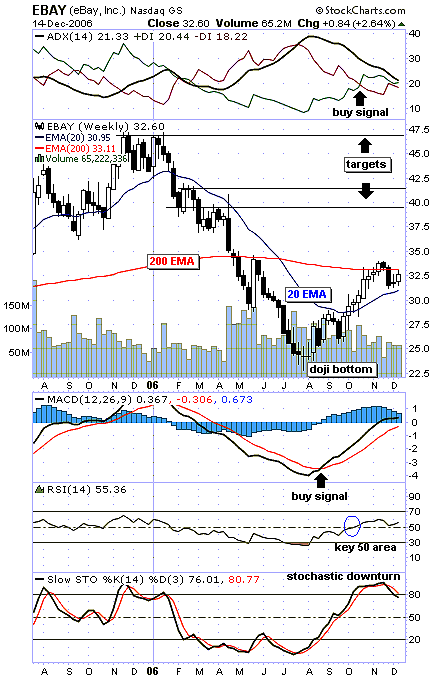
| Figure 1, a weekly chart of eBay (EBAY), shows a doji bottom from late July. Dojis often mark important turning points after a significant rise or fall. In this case, the intrepid bottom-picker who took a chance on this potential turnaround signal would be sitting on a 30% gain over four months. |
| Now another potential entry point draws near in the form of an overhead resistance test at the 200-period exponential moving average (EMA). Note how the stock price is caught between the 200-period EMA resistance and the 20-period EMA support. The outcome here will likely be a tradable move. Current action seems to hint at the successful support off the often-telling 20-period EMA. If so, the next close above the 200-period EMA could signal the next upleg. On the other hand, a sudden reversal to close below the 20-period EMA would be bearish, possibly leading to a double bottom test. |

|
| FIGURE 1: EBAY, WEEKLY. This chart shows the stock caught between two moving average lines. Watch for a coming resolution. |
| Graphic provided by: StockCharts.com. |
| |
| Several indicators should be examined at this point. At the top of Figure 1, the directional movement indicator with its three parameters shows a bullish cross of its positive and negative directional indicators (DIs). This points to a shift to bullish power. The earliest buy signal confirming the bullish doji candlestick came with the moving average convergence/divergence (MACD) crossover. The next buy signal was the relative strength index (RSI) moving above the key 50 area, which coincides with the close above the 20-period EMA. Finally, the aforementioned DI crossover kicks in, lagging the other indicators. |
| The cautionary indicator is the stochastic oscillator showing a downturn from overbought levels. However, if support from the 20-period EMA holds, it will manifest as a "high stochastic turn." With enough bullishness, the stochastic oscillator can "stick high," indicating the presence of a strong uptrend in place. |
| The upside targets for another bullish upthrust are shown as a former resistance zone of $40–42 and then the previous high of $47. But first, the 200-period EMA must be beaten. |
Independent Canadian equities trader and technical analyst based in Peterborough
Ontario, Canada.
| Website: | www.whatsonsale.ca/financial.html |
| E-mail address: | gwg7@sympatico.ca |
Click here for more information about our publications!
Comments
Date: 12/18/06Rank: 2Comment:
Date: 12/19/06Rank: 5Comment:

Request Information From Our Sponsors
- StockCharts.com, Inc.
- Candle Patterns
- Candlestick Charting Explained
- Intermarket Technical Analysis
- John Murphy on Chart Analysis
- John Murphy's Chart Pattern Recognition
- John Murphy's Market Message
- MurphyExplainsMarketAnalysis-Intermarket Analysis
- MurphyExplainsMarketAnalysis-Visual Analysis
- StockCharts.com
- Technical Analysis of the Financial Markets
- The Visual Investor
- VectorVest, Inc.
- Executive Premier Workshop
- One-Day Options Course
- OptionsPro
- Retirement Income Workshop
- Sure-Fire Trading Systems (VectorVest, Inc.)
- Trading as a Business Workshop
- VectorVest 7 EOD
- VectorVest 7 RealTime/IntraDay
- VectorVest AutoTester
- VectorVest Educational Services
- VectorVest OnLine
- VectorVest Options Analyzer
- VectorVest ProGraphics v6.0
- VectorVest ProTrader 7
- VectorVest RealTime Derby Tool
- VectorVest Simulator
- VectorVest Variator
- VectorVest Watchdog
