HOT TOPICS LIST
- MACD
- Fibonacci
- RSI
- Gann
- ADXR
- Stochastics
- Volume
- Triangles
- Futures
- Cycles
- Volatility
- ZIGZAG
- MESA
- Retracement
- Aroon
INDICATORS LIST
LIST OF TOPICS
PRINT THIS ARTICLE
by David Penn
Negative divergences took the dollar down in October. Will positive divergences bring the dollar back up a year later?
Position: N/A
David Penn
Technical Writer for Technical Analysis of STOCKS & COMMODITIES magazine, Working-Money.com, and Traders.com Advantage.
PRINT THIS ARTICLE
REVERSAL
Dollar Divergences: Up And Down
12/12/06 02:52:24 PMby David Penn
Negative divergences took the dollar down in October. Will positive divergences bring the dollar back up a year later?
Position: N/A
| A few months ago I suggested that the US dollar was nearing a low ("The Greenback Lows," September 8, 2006). At the time, I was focusing on the spring 2006 lows, which seemed to be a place of support near the 84 level (basis continuous US dollar index futures). That wasn't a bad bet, at least for a little while, as the greenback managed to consolidate between 84 and about 87 from early May to late November. |
| However, in late November, the greenback broke down again, taking out support at 84 and threatening to take out the October 2005 lows near 81. Dollar panic soared, perhaps culminating with a recent speech by Alan Greenspan in which the former Federal Reserve Board chief announced that "the dollar would probably keep falling" because, among other things, international fund managers were "unlikely" to increase their "allocations to the US currency." |

|
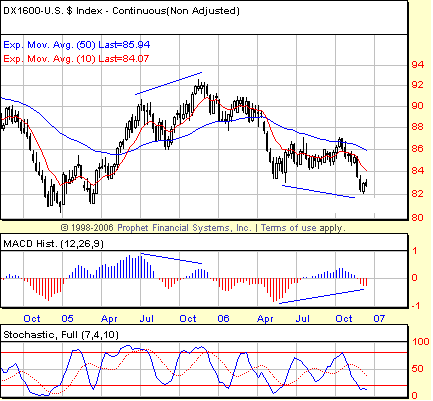
| FIGURE 1: US DOLLAR INDEX, CONTINUOUS FUTURES, WEEKLY. Divergences on weekly charts are often best spotted with the MACD histogram, as the negative divergences in the second half of 2005 and positive divergence in 2006 attest. These divergences are confirmed by divergences in the stochastic (lines not shown because of space limitations). |
| Graphic provided by: Prophet Financial, Inc. |
| |
| We should remember that Alan Greenspan was also the man who encouraged Americans to load up on adjustable-rate mortgage loans in the spring of 2004, shortly after the 10-year note rebounded from all-time lows. As columnist Terry Savage of the Chicago Sun-Times noted at the time, "Greenspan has a track record of forecasting mistakes." Thus, I'll admit that as soon as I heard of Greenspan's bearishness on the dollar, I started looking for positive divergences on the chart of the greenback. |
| And positive divergences were exactly what I found. Divergences have done an excellent job in anticipating the major moves of the dollar since it bottomed in late 2004. When the dollar topped out in November 2005, it established negative divergences in both the moving average convergence/divergence (MACD) histogram and the stochastic on the weekly chart (Figure 1). With weekly charts, I tend to give more weight to MACD histogram divergences than stochastic ones, but with both indicators confirming each other, the top seemed particularly well-indicated. And from a level just north of 92 in November 2005, the greenback would find itself balancing on 82 approximately a year later. |
| Divergences again appear to be coming into play in late 2006. As the dollar moves closer and closer to what is largely believed to be a final goal line stand at 81, we can see that both the MACD histogram and stochastic have refused to confirm the most recent lower low in the greenback. If that pattern holds up, there is a strong likelihood that the greenback's worst days are behind it, with days of perhaps surprising strength all that lie ahead. |
Technical Writer for Technical Analysis of STOCKS & COMMODITIES magazine, Working-Money.com, and Traders.com Advantage.
| Title: | Technical Writer |
| Company: | Technical Analysis, Inc. |
| Address: | 4757 California Avenue SW |
| Seattle, WA 98116 | |
| Phone # for sales: | 206 938 0570 |
| Fax: | 206 938 1307 |
| Website: | www.Traders.com |
| E-mail address: | DPenn@traders.com |
Traders' Resource Links | |
| Charting the Stock Market: The Wyckoff Method -- Books | |
| Working-Money.com -- Online Trading Services | |
| Traders.com Advantage -- Online Trading Services | |
| Technical Analysis of Stocks & Commodities -- Publications and Newsletters | |
| Working Money, at Working-Money.com -- Publications and Newsletters | |
| Traders.com Advantage -- Publications and Newsletters | |
| Professional Traders Starter Kit -- Software | |
Click here for more information about our publications!
Comments
Date: 12/12/06Rank: 3Comment:

Request Information From Our Sponsors
- VectorVest, Inc.
- Executive Premier Workshop
- One-Day Options Course
- OptionsPro
- Retirement Income Workshop
- Sure-Fire Trading Systems (VectorVest, Inc.)
- Trading as a Business Workshop
- VectorVest 7 EOD
- VectorVest 7 RealTime/IntraDay
- VectorVest AutoTester
- VectorVest Educational Services
- VectorVest OnLine
- VectorVest Options Analyzer
- VectorVest ProGraphics v6.0
- VectorVest ProTrader 7
- VectorVest RealTime Derby Tool
- VectorVest Simulator
- VectorVest Variator
- VectorVest Watchdog
- StockCharts.com, Inc.
- Candle Patterns
- Candlestick Charting Explained
- Intermarket Technical Analysis
- John Murphy on Chart Analysis
- John Murphy's Chart Pattern Recognition
- John Murphy's Market Message
- MurphyExplainsMarketAnalysis-Intermarket Analysis
- MurphyExplainsMarketAnalysis-Visual Analysis
- StockCharts.com
- Technical Analysis of the Financial Markets
- The Visual Investor
