HOT TOPICS LIST
- MACD
- Fibonacci
- RSI
- Gann
- ADXR
- Stochastics
- Volume
- Triangles
- Futures
- Cycles
- Volatility
- ZIGZAG
- MESA
- Retracement
- Aroon
INDICATORS LIST
LIST OF TOPICS
PRINT THIS ARTICLE
by David Penn
Consolidations in trends tend to lead to more trend. Will this hold true for the autumn consolidation in the QQQQ?
Position: N/A
David Penn
Technical Writer for Technical Analysis of STOCKS & COMMODITIES magazine, Working-Money.com, and Traders.com Advantage.
PRINT THIS ARTICLE
TRIANGLES
Q Is For Consolidation
12/12/06 12:51:50 PMby David Penn
Consolidations in trends tend to lead to more trend. Will this hold true for the autumn consolidation in the QQQQ?
Position: N/A
| The more I hear market observers complain about the absence of a meaningful consolidation in the rally that began in the summer of 2006, the higher I'm inclined to believe the market is likely to go. Rising markets like nothing better than a wall of worry to ascend, and whether the bricks of that wall consist of a Democratic takeover of Congress, an imploding housing market, sectarian conflict/civil war in Iraq, or a collapsing dollar, the market continues to use every excuse for moving lower as an opportunity to move higher. |
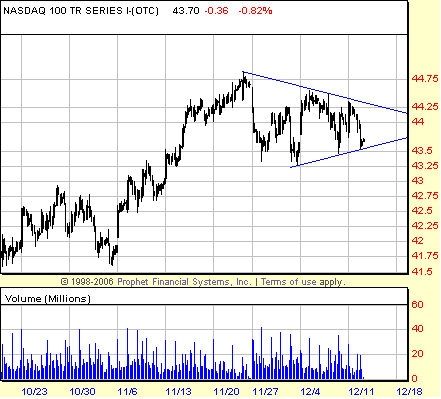
| That is, at least until late November (Figure 1). Since the week leading up to the US Thanksgiving holiday, the markets in general have slipped into a sideways consolidation. What has been remarkable about this consolidation is that while it has not been severe in percentage terms (at its lowest point, the correction in the NASDAQ was 3% off the high), it does seem to have brought out the worrywarts and allowed an admittedly hot market to cool off. |

|
| FIGURE 1: NASDAQ 100 TRUST SERIES (QQQQ), HOURLY. After rallying from under 36 in mid-July, the QQQQ came to within cents of 45 in late November before slipping into a sideways consolidation with many of the distinguishing features of a symmetrical triangle. |
| Graphic provided by: Prophet Financial, Inc. |
| |
| Taking a look at one such market, it appears that the consolidation in the NASDAQ 100 or QQQQ has taken on the form of a symmetrical triangle. This triangle began on November 24 and made touches of the converging trendlines on December 1, 5, 7, 8, and 11. These are clearly enough touches to confirm the boundaries of the triangle and the fact that those converging trendlines have been confirmed before prices moved more than two-thirds of the way through the triangle means that it is all the more likely that the triangle pattern is valid. The only question that remains is: In what direction will the breakout or breakdown be? |
| As long as the QQQQ are trading above the 50-day exponential moving average (EMA), there really isn't any reason to anticipate shorting them, save for a purely speculative venture. In trading just above the 50-day EMA (the QQQQ last closed at 44.06, while the 50-day EMA was last at 42.86), there's every reason to believe that any breakdown from the triangle noted above would merely take the QQQQ toward a test of the 50-day EMA and, potentially, into a great opportunity for traders to buy off of that intermediate-term support. Indeed, with a formation size of about 1.4 points and a breakdown level at approximately 43.6 (the lower boundary of the triangle), the initial target for a downside break would be 42.2 — very much in the neighborhood of that 50-day EMA. |
| With regard to the upside, that same formation size added to an upside breakout level of approximately 44.3 provides for an initial breakout target of about 45.7. Given that the December expiration is only a few days away, it wouldn't surprise me if the QQQQ remained depressed below 45 until after Friday, when a Santa Claus rally into the end of the year could begin in earnest. |
Technical Writer for Technical Analysis of STOCKS & COMMODITIES magazine, Working-Money.com, and Traders.com Advantage.
| Title: | Technical Writer |
| Company: | Technical Analysis, Inc. |
| Address: | 4757 California Avenue SW |
| Seattle, WA 98116 | |
| Phone # for sales: | 206 938 0570 |
| Fax: | 206 938 1307 |
| Website: | www.Traders.com |
| E-mail address: | DPenn@traders.com |
Traders' Resource Links | |
| Charting the Stock Market: The Wyckoff Method -- Books | |
| Working-Money.com -- Online Trading Services | |
| Traders.com Advantage -- Online Trading Services | |
| Technical Analysis of Stocks & Commodities -- Publications and Newsletters | |
| Working Money, at Working-Money.com -- Publications and Newsletters | |
| Traders.com Advantage -- Publications and Newsletters | |
| Professional Traders Starter Kit -- Software | |
Click here for more information about our publications!
Comments
Date: 12/12/06Rank: 5Comment:
Date: 12/12/06Rank: 3Comment:
Date: 12/27/06Rank: 5Comment:

Request Information From Our Sponsors
- StockCharts.com, Inc.
- Candle Patterns
- Candlestick Charting Explained
- Intermarket Technical Analysis
- John Murphy on Chart Analysis
- John Murphy's Chart Pattern Recognition
- John Murphy's Market Message
- MurphyExplainsMarketAnalysis-Intermarket Analysis
- MurphyExplainsMarketAnalysis-Visual Analysis
- StockCharts.com
- Technical Analysis of the Financial Markets
- The Visual Investor
- VectorVest, Inc.
- Executive Premier Workshop
- One-Day Options Course
- OptionsPro
- Retirement Income Workshop
- Sure-Fire Trading Systems (VectorVest, Inc.)
- Trading as a Business Workshop
- VectorVest 7 EOD
- VectorVest 7 RealTime/IntraDay
- VectorVest AutoTester
- VectorVest Educational Services
- VectorVest OnLine
- VectorVest Options Analyzer
- VectorVest ProGraphics v6.0
- VectorVest ProTrader 7
- VectorVest RealTime Derby Tool
- VectorVest Simulator
- VectorVest Variator
- VectorVest Watchdog
