HOT TOPICS LIST
- MACD
- Fibonacci
- RSI
- Gann
- ADXR
- Stochastics
- Volume
- Triangles
- Futures
- Cycles
- Volatility
- ZIGZAG
- MESA
- Retracement
- Aroon
INDICATORS LIST
LIST OF TOPICS
PRINT THIS ARTICLE
by Paolo Pezzutti
This candlestick pattern, which is quite rare and usually reliable, has provided some wrong signals lately.
Position: N/A
Paolo Pezzutti
Author of the book "Trading the US Markets - A Comprehensive Guide to US Markets for International Traders and Investors" - Harriman House (July 2008)
PRINT THIS ARTICLE
CANDLESTICK CHARTING
The Falling Three Method
12/08/06 02:28:39 PMby Paolo Pezzutti
This candlestick pattern, which is quite rare and usually reliable, has provided some wrong signals lately.
Position: N/A
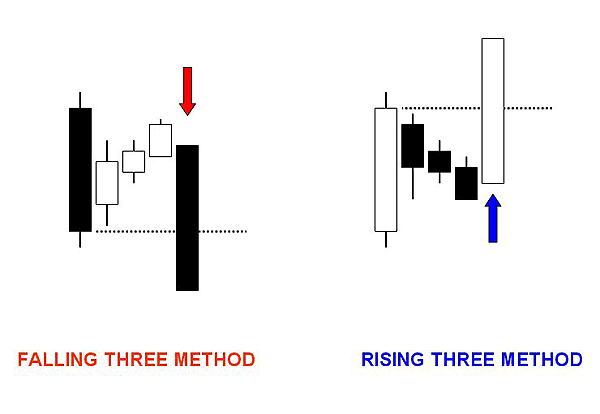
| The "falling three method" is a bearish continuation candlestick pattern. The "rising three method" pattern is basically the opposite (Figure 1). Let's look at the rules. The market has been in a downtrend. At that point, you observe: -A long black candle -A series of small candles, preferably with a white body. There should be three, but there can be also two or more than three. Their high is not above the open of the big black candle. The countertrend candles remain within the first session's range. -The last candle of the pattern opens within the body of the last countertrend bar and the close lower than the first big black candle's close. After this last black candle, the market should continue lower. |

|
| FIGURE 1: FALLING VS. RISING. This five-candles pattern (here compared with its counterpart, the rising three) represents a typical continuation pattern. |
| Graphic provided by: powerpoint. |
| |
| The volume of the first and last black candles should be higher than the small countertrend candles. This pattern is similar to a bearish flag or a short pennant. The concept is that prices, after an expansion to the downside, print a pause in the downtrend. Bulls, however, are unable to bring prices higher than the impulse candle. After a few days of low range and volume where prices do not progress significantly to the upside, the bulls give up and the downtrend resumes. The last day of the pattern represents the capitulation of the bulls and the confirmation of the ongoing downtrend. |

|
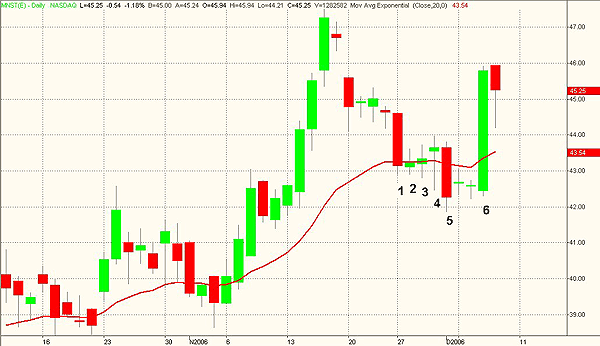
| FIGURE 2: MNST, DAILY. Here, the stock printed a nice pattern that, however, was negated by the impressive wide ranging day at point 6. |
| Graphic provided by: TradeStation. |
| |
| The pattern is usually deemed as reliable, but last week most of the stocks that developed the pattern experienced a failure of the formation. In Figure 2, you can see that Monster Worldwide (MNST) at point 1 printed a long black candle followed by three countertrend small candles (points 2, 3, and 4). Note that the three candles did not manage to retrace much of the first down candle. Friday's session (point 5) displays a long black candle that resumes the downtrend. At point 6, however, an impressive wide ranging day to the upside negated the formation. |

|
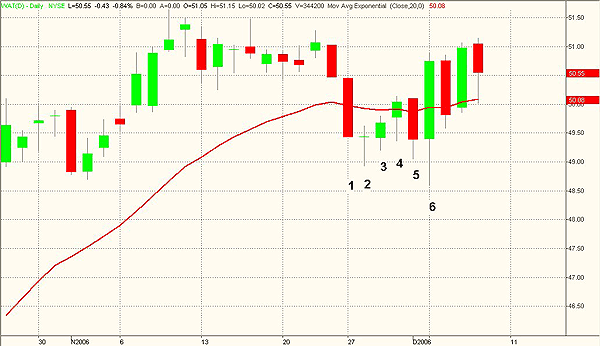
| FIGURE 3: WAT, DAILY. In addition, this stock printed a failure of the pattern which, however, did not present optimal characteristics. |
| Graphic provided by: TradeStation. |
| |
| In Figure 3, Waters Corp. (WAT) last week printed the falling three method pattern. Note, however, that the last candle of the pattern at point 5 did not manage to close significantly lower than the previous bars of the formation. In addition, the open was not within the previous candle's body. In any case, the pattern was a good candidate to be traded as the stock had displayed ease of movement to the downside. The next day at point 6, prices reacted to the upside, negating the pattern and producing a loss. |

|
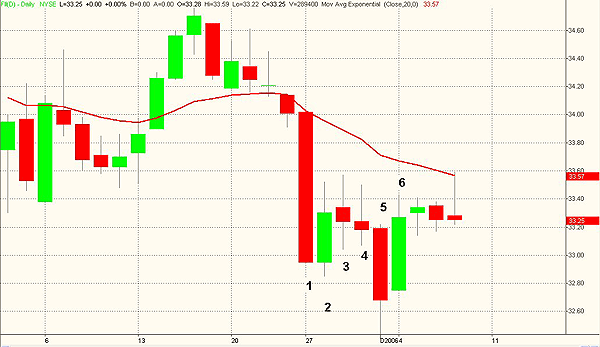
| FIGURE 4: FII, DAILY. Another failure for the pattern. At point 6 a trend day negated the formation. |
| Graphic provided by: TradeStation. |
| |
| In Figure 4, Federated Investors B (FII) printed a pattern in which points 3 and 4 displayed a black body. The impulse to the downside of the first candle indicated clearly that prices would move to the downside. In addition, the last candle of the pattern confirmed the downtrend. The next candle at point 6, also in this case, negated the pattern. Risk control must be one of the top priorities. Although this candlestick pattern is usually reliable, failure and the possibility of a loss must be taken into account by traders. |
Author of the book "Trading the US Markets - A Comprehensive Guide to US Markets for International Traders and Investors" - Harriman House (July 2008)
| Address: | VIA ROBERTO AGO 26 POSTAL CODE 00166 |
| Rome, ITALY | |
| Phone # for sales: | +393357540708 |
| E-mail address: | pezzutti.paolo@tiscali.it |
Click here for more information about our publications!
Comments
Date: 12/08/06Rank: 3Comment:
Date: 12/11/06Rank: Comment: Is it not that there are exceptions to the rule then why we put stop losses. Tech Analysis is more of arts than science.

Request Information From Our Sponsors
- StockCharts.com, Inc.
- Candle Patterns
- Candlestick Charting Explained
- Intermarket Technical Analysis
- John Murphy on Chart Analysis
- John Murphy's Chart Pattern Recognition
- John Murphy's Market Message
- MurphyExplainsMarketAnalysis-Intermarket Analysis
- MurphyExplainsMarketAnalysis-Visual Analysis
- StockCharts.com
- Technical Analysis of the Financial Markets
- The Visual Investor
- VectorVest, Inc.
- Executive Premier Workshop
- One-Day Options Course
- OptionsPro
- Retirement Income Workshop
- Sure-Fire Trading Systems (VectorVest, Inc.)
- Trading as a Business Workshop
- VectorVest 7 EOD
- VectorVest 7 RealTime/IntraDay
- VectorVest AutoTester
- VectorVest Educational Services
- VectorVest OnLine
- VectorVest Options Analyzer
- VectorVest ProGraphics v6.0
- VectorVest ProTrader 7
- VectorVest RealTime Derby Tool
- VectorVest Simulator
- VectorVest Variator
- VectorVest Watchdog
