HOT TOPICS LIST
- MACD
- Fibonacci
- RSI
- Gann
- ADXR
- Stochastics
- Volume
- Triangles
- Futures
- Cycles
- Volatility
- ZIGZAG
- MESA
- Retracement
- Aroon
INDICATORS LIST
LIST OF TOPICS
PRINT THIS ARTICLE
by Arthur Hill
A resistance breakout with a gap and high volume open the door to higher prices for Home Depot.
Position: Accumulate
Arthur Hill
Arthur Hill is currently editor of TDTrader.com, a website specializing in trading strategies, sector/industry specific breadth stats and overall technical analysis. He passed the Society of Technical Analysts (STA London) diploma exam with distinction is a Certified Financial Technician (CFTe). Prior to TD Trader, he was the Chief Technical Analyst for Stockcharts.com and the main contributor to the ChartSchool.
PRINT THIS ARTICLE
GAPS
Mind The Gap For Home Depot
12/05/06 12:50:18 PMby Arthur Hill
A resistance breakout with a gap and high volume open the door to higher prices for Home Depot.
Position: Accumulate
| Home Depot (HD) is an important bellwether stock that is part of the Dow Jones industrials, Standard & Poor's 100, S&P 500, consumer discretionary sector, and retail industry group. As its name implies, the consumer discretionary sector is the most economically sensitive and reflects the economic environment. Retail spending accounts for two-thirds of the GDP and this is an important part of the economy. HD's performance reflects overall market conditions, and the recent breakout bodes well for the market as a whole. |
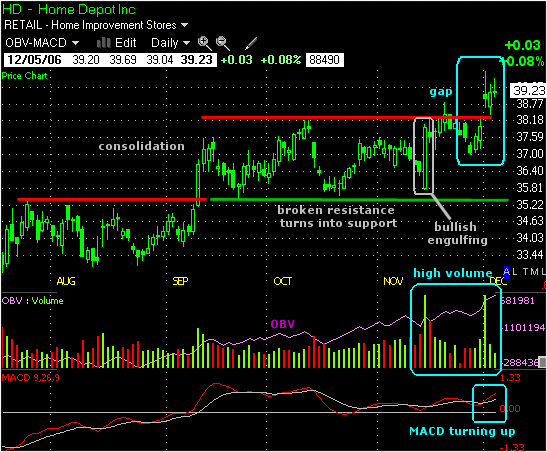
| On the price chart (Figure 1), Home Depot broke resistance in September with a big surge on high volume. The stock then consolidated in the next two months with a volatile trading range (35.5–38.3). This range featured a gap down on October 12 and a big bullish engulfing pattern on November 14. The bullish engulfing pattern occurred on high volume and solidified support around 35.5. It was a violent range, but support held and buyers never caved in. More important, the stock followed through on the bullish engulfing pattern with a breakout at 38.3. The breakout occurred with a gap and high volume. The gap is bullish as long as it remains unfilled, and traders should watch for a move below 37 to negate this signal. |

|
| FIGURE 1: HOME DEPOT. HD broke resistance in September with a big surge on high volume. |
| Graphic provided by: TC2000.com. |
| Graphic provided by: Telechart 2007. |
| |
| Key indicators confirm underlying strength and buying pressure. On-balance volume (OBV, purple line) bottomed in late August and moved steadily higher the last few months. OBV moved to a multimonth high in December and new buying is coming into the stock. The moving average convergence/divergence (MACD) moved into positive territory in September and has remained largely positive the last few months. There was a brief dip into negative territory in October, but this key momentum indicator quickly recovered. The MACD moved back above its signal line in December and momentum is moving back up. |
Arthur Hill is currently editor of TDTrader.com, a website specializing in trading strategies, sector/industry specific breadth stats and overall technical analysis. He passed the Society of Technical Analysts (STA London) diploma exam with distinction is a Certified Financial Technician (CFTe). Prior to TD Trader, he was the Chief Technical Analyst for Stockcharts.com and the main contributor to the ChartSchool.
| Title: | Editor |
| Company: | TDTrader.com |
| Address: | Willem Geetsstraat 17 |
| Mechelen, B2800 | |
| Phone # for sales: | 3215345465 |
| Website: | www.tdtrader.com |
| E-mail address: | arthurh@tdtrader.com |
Traders' Resource Links | |
| TDTrader.com has not added any product or service information to TRADERS' RESOURCE. | |
Click here for more information about our publications!
Comments
Date: 12/07/06Rank: 4Comment:
Date: 12/27/06Rank: 5Comment:

Request Information From Our Sponsors
- VectorVest, Inc.
- Executive Premier Workshop
- One-Day Options Course
- OptionsPro
- Retirement Income Workshop
- Sure-Fire Trading Systems (VectorVest, Inc.)
- Trading as a Business Workshop
- VectorVest 7 EOD
- VectorVest 7 RealTime/IntraDay
- VectorVest AutoTester
- VectorVest Educational Services
- VectorVest OnLine
- VectorVest Options Analyzer
- VectorVest ProGraphics v6.0
- VectorVest ProTrader 7
- VectorVest RealTime Derby Tool
- VectorVest Simulator
- VectorVest Variator
- VectorVest Watchdog
- StockCharts.com, Inc.
- Candle Patterns
- Candlestick Charting Explained
- Intermarket Technical Analysis
- John Murphy on Chart Analysis
- John Murphy's Chart Pattern Recognition
- John Murphy's Market Message
- MurphyExplainsMarketAnalysis-Intermarket Analysis
- MurphyExplainsMarketAnalysis-Visual Analysis
- StockCharts.com
- Technical Analysis of the Financial Markets
- The Visual Investor
