HOT TOPICS LIST
- MACD
- Fibonacci
- RSI
- Gann
- ADXR
- Stochastics
- Volume
- Triangles
- Futures
- Cycles
- Volatility
- ZIGZAG
- MESA
- Retracement
- Aroon
INDICATORS LIST
LIST OF TOPICS
PRINT THIS ARTICLE
by Koos van der Merwe
On October 31, Jim Flaherty, the Canadian Minister of Finance, effectively wiped off $30 billion from the Canadian stock market. What does this mean for you?
Position: Accumulate
Koos van der Merwe
Has been a technical analyst since 1969, and has worked as a futures and options trader with First Financial Futures in Johannesburg, South Africa.
PRINT THIS ARTICLE
HEAD & SHOULDERS
The Canadian Income Trust Debacle
12/05/06 12:36:26 PMby Koos van der Merwe
On October 31, Jim Flaherty, the Canadian Minister of Finance, effectively wiped off $30 billion from the Canadian stock market. What does this mean for you?
Position: Accumulate
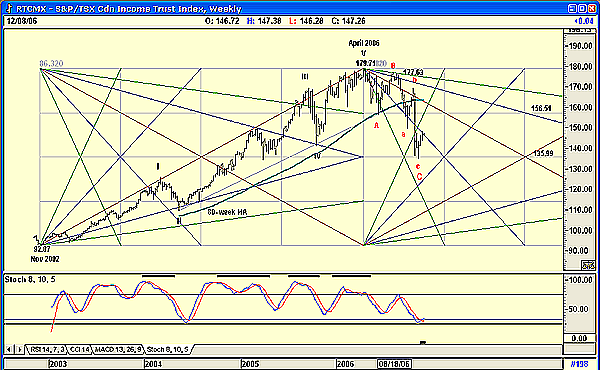
| In pre-election speeches, Stephen Harper, the Prime Minister of Canada, promised voters, "We will not tax income trusts." Taking him at his word, and forgetting that most politicians are liars, seniors from all over Canada poured their retirement assets into income trusts to take advantage of the above-average yields that were offered. Figure 1, my weekly chart of the income trust index, shows how the index rose from a low of 92.87 in November 2002 to a high of 179.71 by April 2006. Income trusts became so popular, they were even included in the Toronto Stock Exchange index. |

|
| FIGURE 1: CANADIAN INCOME TRUST INDEX, WEEKLY. Note that there are Gann fans, Gann squares, and an Elliott wave pattern. |
| Graphic provided by: AdvancedGET. |
| |
| The pattern shown is a classic five-wave impulse upward. From the high of April 2006, the index fell in a wave A to 156.51 and recovered in a B-wave to 177.63. From this level, it fell in wave a of wave C recovered and then fell dramatically in wave c of wave C when the announcement was made, which many believed was a trick-or-treat hoax. Chartists would have been aware of the C-wave pattern that developed, and many would have taken profits as the index retreated from the wave V top, but the nonchartist, the average long-term investor, would have left their funds invested and did leave their funds in trusts, lured by the high yields offered. |
| In Figure 2, note the following: a. The chart pattern follows the first rule of Elliott wave theory, namely, the chart must look right. b. Both the A-wave correction and the C-wave correction bounced off the rule of 8 lines suggested by Gann analysis. c. That wave A also bounced off the 80-week moving average. d. The stochastic Indicator is oversold, and suggesting a buy. Flaherty's nightmare bill has still to come before Parliament. The chart, if wave C is confirmed, and it looks as if it is, suggests that the bill is in trouble. Recent polls show that the Tory minority government will lose the next election should it occur in the early part of 2007, and with a number of elected Members of Parliament listening to the dissatisfaction of their electorate, a vote against the bill or an amendment to the bill is almost a certainty. |

|
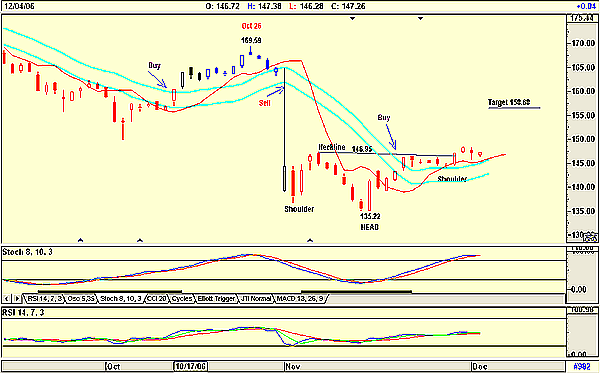
| FIGURE 2: CANADIAN INCOME TRUST INDEX, DAILY. Here's the inverse head & shoulders pattern with the suggested target. |
| Graphic provided by: AdvancedGET. |
| |
| Figure 2, a daily chart, shows that this is most probably what is going to happen. I say "most probably," because a reverse head & shoulders pattern could be developing. The target is 158.68 (146.95-135.22=11.73 + 146.95 = 158.68.). The target is not near the high of 169.59 on October 26, yet could consolidate at this level as Parliament fights it out. In addition, do note the following: a. The index has broken above the neckline. b. The index has also moved above the JM internal band giving a buy signal. c. The stochastic oscillator is suggesting weakness because it is overbought, but hasn't yet given a sell signal. d. The RSI is trending upward. Charts are positive, and as Senator Jerry Grafstein so aptly put it, "This decision was so profound on our economy that we must be damn sure about what's going to happen in the future. ... There should be a public enquiry to study this." |
| Whatever the politicians eventually decide, my charts are saying, "Buy income trusts." |
Has been a technical analyst since 1969, and has worked as a futures and options trader with First Financial Futures in Johannesburg, South Africa.
| Address: | 3256 West 24th Ave |
| Vancouver, BC | |
| Phone # for sales: | 6042634214 |
| E-mail address: | petroosp@gmail.com |
Click here for more information about our publications!
Comments
Date: 12/07/06Rank: 2Comment:
Date: 12/12/06Rank: 5Comment:
Date: 12/13/06Rank: 3Comment:

Request Information From Our Sponsors
- StockCharts.com, Inc.
- Candle Patterns
- Candlestick Charting Explained
- Intermarket Technical Analysis
- John Murphy on Chart Analysis
- John Murphy's Chart Pattern Recognition
- John Murphy's Market Message
- MurphyExplainsMarketAnalysis-Intermarket Analysis
- MurphyExplainsMarketAnalysis-Visual Analysis
- StockCharts.com
- Technical Analysis of the Financial Markets
- The Visual Investor
- VectorVest, Inc.
- Executive Premier Workshop
- One-Day Options Course
- OptionsPro
- Retirement Income Workshop
- Sure-Fire Trading Systems (VectorVest, Inc.)
- Trading as a Business Workshop
- VectorVest 7 EOD
- VectorVest 7 RealTime/IntraDay
- VectorVest AutoTester
- VectorVest Educational Services
- VectorVest OnLine
- VectorVest Options Analyzer
- VectorVest ProGraphics v6.0
- VectorVest ProTrader 7
- VectorVest RealTime Derby Tool
- VectorVest Simulator
- VectorVest Variator
- VectorVest Watchdog
