HOT TOPICS LIST
- MACD
- Fibonacci
- RSI
- Gann
- ADXR
- Stochastics
- Volume
- Triangles
- Futures
- Cycles
- Volatility
- ZIGZAG
- MESA
- Retracement
- Aroon
INDICATORS LIST
LIST OF TOPICS
PRINT THIS ARTICLE
by David Penn
A correction ends with a classic bottoming pattern.
Position: N/A
David Penn
Technical Writer for Technical Analysis of STOCKS & COMMODITIES magazine, Working-Money.com, and Traders.com Advantage.
PRINT THIS ARTICLE
REVERSAL
Short-Term 2B Bottom In Hourly QQQQ
12/05/06 01:04:57 PMby David Penn
A correction ends with a classic bottoming pattern.
Position: N/A
| While there are a number of ways to catch a reversal in a market, two of the fastest involve divergences and the 2B/Turtle Soup test. Both setups can be relied on individually, but what is great about them is that they can also be used to complement each other and provide a trader or investor with even greater confidence that a given trading decision is a wise one. |

|
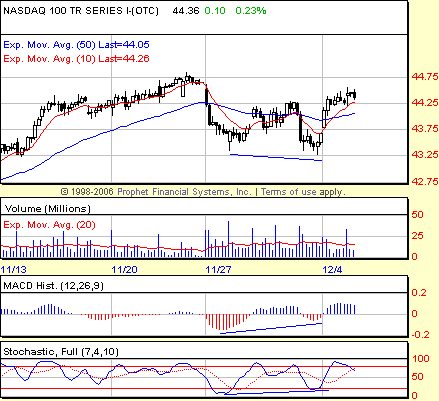
| FIGURE 1: NASDAQ 100 TRUST SERIES (QQQQ), HOURLY. During a correction, the Q makes a low and then a marginally lower low that is not confirmed by either the MACD histogram or the stochastic, both of which make higher lows. This positive divergence underscores the argument for a successful 2B/Turtle Soup test of bottom insofar as there was no follow-through in price to the downside when the QQQQ made its second lower low. |
| Graphic provided by: Prophet Financial, Inc. |
| |
| In a sense, both the positive divergence and the 2B/Turtle Soup test of bottom are suggesting the same thing of a given market: that there has been a loss of momentum to the downside at just the moment when a market seems as if it is headed lower. In the case of the positive divergence, the higher low of the indicator — in the MACD histogram or the stochastic — is evidence of the loss of momentum as the market moves lower. With the 2B/Turtle Soup test of bottom, we have an actual loss of momentum when the second, lower low is made, yet there is no further price action, no follow-through, in the wake of that lower low. Other technical features, such as long lower tails or shadows on the candlesticks as the lows are being established, can also complement a bottom call — to say nothing of clear bullish reversal candlestick patterns such as the hammer (arguably a version of which appears in the hourly QQQQ chart in Figure 1 on the second lower low). |
| Trading these bottoms is straightforward. With the positive divergence in the histogram, I rely on an uptick from the lowest histogram bar as a trigger. If one session marks the histogram low and the next session has a higher histogram, that second session is the one I will use to create an entry level. The entry level is derived by taking the range of the session, dividing it in half, and adding that amount to the high of the session. In this case, the entry level would have been at approximately 43.65. With the 2B/Turtle Soup test of bottom entry, I look for the high of the initial low, which in this case was at 43.73. Now, as soon as the market rallies from the second lower low to a point above 43.73, I would go long. In this instance, the 2B/Turtle Soup test of bottom entry is a few cents higher than the positive divergence entry. That will vary depending on the market. |
Technical Writer for Technical Analysis of STOCKS & COMMODITIES magazine, Working-Money.com, and Traders.com Advantage.
| Title: | Technical Writer |
| Company: | Technical Analysis, Inc. |
| Address: | 4757 California Avenue SW |
| Seattle, WA 98116 | |
| Phone # for sales: | 206 938 0570 |
| Fax: | 206 938 1307 |
| Website: | www.Traders.com |
| E-mail address: | DPenn@traders.com |
Traders' Resource Links | |
| Charting the Stock Market: The Wyckoff Method -- Books | |
| Working-Money.com -- Online Trading Services | |
| Traders.com Advantage -- Online Trading Services | |
| Technical Analysis of Stocks & Commodities -- Publications and Newsletters | |
| Working Money, at Working-Money.com -- Publications and Newsletters | |
| Traders.com Advantage -- Publications and Newsletters | |
| Professional Traders Starter Kit -- Software | |
Click here for more information about our publications!
Comments
Date: 12/07/06Rank: 3Comment:

Request Information From Our Sponsors
- VectorVest, Inc.
- Executive Premier Workshop
- One-Day Options Course
- OptionsPro
- Retirement Income Workshop
- Sure-Fire Trading Systems (VectorVest, Inc.)
- Trading as a Business Workshop
- VectorVest 7 EOD
- VectorVest 7 RealTime/IntraDay
- VectorVest AutoTester
- VectorVest Educational Services
- VectorVest OnLine
- VectorVest Options Analyzer
- VectorVest ProGraphics v6.0
- VectorVest ProTrader 7
- VectorVest RealTime Derby Tool
- VectorVest Simulator
- VectorVest Variator
- VectorVest Watchdog
- StockCharts.com, Inc.
- Candle Patterns
- Candlestick Charting Explained
- Intermarket Technical Analysis
- John Murphy on Chart Analysis
- John Murphy's Chart Pattern Recognition
- John Murphy's Market Message
- MurphyExplainsMarketAnalysis-Intermarket Analysis
- MurphyExplainsMarketAnalysis-Visual Analysis
- StockCharts.com
- Technical Analysis of the Financial Markets
- The Visual Investor
