HOT TOPICS LIST
- MACD
- Fibonacci
- RSI
- Gann
- ADXR
- Stochastics
- Volume
- Triangles
- Futures
- Cycles
- Volatility
- ZIGZAG
- MESA
- Retracement
- Aroon
INDICATORS LIST
LIST OF TOPICS
PRINT THIS ARTICLE
by David Penn
An autumn consolidation in the retail HOLDRS hints at the possibility of a move lower for retail stocks.
Position: N/A
David Penn
Technical Writer for Technical Analysis of STOCKS & COMMODITIES magazine, Working-Money.com, and Traders.com Advantage.
PRINT THIS ARTICLE
HEAD & SHOULDERS
A Head & Shoulders Top In Retail?
12/01/06 03:30:35 PMby David Penn
An autumn consolidation in the retail HOLDRS hints at the possibility of a move lower for retail stocks.
Position: N/A
Over at "The Big Picture," one of my favorite "general purpose" weblogs, blogger (and money manager) Barry Ritholz made an interesting point about retail in the 2006 holiday season:One of the issues we have been discussing has been how widely and deeply Retailers will be discounting, and what it means to the overall economy. With that backdrop, the behavior of retail stocks — as a group — is increasingly understandable. While price cutting — particularly "panic" price cutting — is a wonderful thing to the holiday shopper, it tends to mean something less fabulous to the companies who feel as if sizable price cuts are the only way to bring shoppers to their stores. The market's interpretation of this price cutting — as represented by the sideways movement in retail stocks — seems to support that idea. |

|
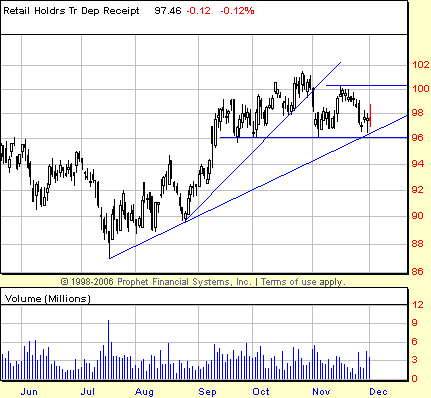
| FIGURE 1: RETAIL HOLDRS, DAILY. After bottoming in July and moving strongly higher in August and early September, the retail HOLDRS (RTH) slipped into a consolidation pattern that resembles a head & shoulders top. |
| Graphic provided by: Prophet Financial, Inc. |
| |
| Specifically, the market's interpretation seems to have included the formation of a head & shoulders top in the retail HOLDRS (Figure 1). At this point (December 1), the pattern is almost perfectly formed, with multiple touches of the neckline at 96, two well-developed shoulders (the last three weeks of September making up the left shoulder and virtually all of November comprising the right), and a "head" that extends above both of them (October). The size of the pattern (approximately five points) is such that a successful breakdown could see the RTH fall to as low as 91 in an initial downside move. |
| There are a number of other, complimentary ways to look at what is happening in the retail HOLDRS. Consider, for example, using a trendline that extends from the low in late August, the RTH has moved into a 1-2-3 trend reversal setup in November. This setup has helped establish key support and resistance levels at 96 and 100, respectively. A break, then, below the neckline would also be a violation of that support level in the 1-2-3 trend reversal setup. If we cast a trendline from the very bottom of the retail HOLDRS bull market in mid-July, then we get a different trendline — one that intersects the support line at 96 in the final day or two of November. If the RTH does not find support on this longer trendline, then the bears will have validation on at least three different levels that retail stocks are headed for an end-of-the-year correction. |
Technical Writer for Technical Analysis of STOCKS & COMMODITIES magazine, Working-Money.com, and Traders.com Advantage.
| Title: | Technical Writer |
| Company: | Technical Analysis, Inc. |
| Address: | 4757 California Avenue SW |
| Seattle, WA 98116 | |
| Phone # for sales: | 206 938 0570 |
| Fax: | 206 938 1307 |
| Website: | www.Traders.com |
| E-mail address: | DPenn@traders.com |
Traders' Resource Links | |
| Charting the Stock Market: The Wyckoff Method -- Books | |
| Working-Money.com -- Online Trading Services | |
| Traders.com Advantage -- Online Trading Services | |
| Technical Analysis of Stocks & Commodities -- Publications and Newsletters | |
| Working Money, at Working-Money.com -- Publications and Newsletters | |
| Traders.com Advantage -- Publications and Newsletters | |
| Professional Traders Starter Kit -- Software | |
Click here for more information about our publications!
Comments
Date: 12/03/06Rank: 3Comment:
Date: 12/05/06Rank: 5Comment:

Request Information From Our Sponsors
- StockCharts.com, Inc.
- Candle Patterns
- Candlestick Charting Explained
- Intermarket Technical Analysis
- John Murphy on Chart Analysis
- John Murphy's Chart Pattern Recognition
- John Murphy's Market Message
- MurphyExplainsMarketAnalysis-Intermarket Analysis
- MurphyExplainsMarketAnalysis-Visual Analysis
- StockCharts.com
- Technical Analysis of the Financial Markets
- The Visual Investor
- VectorVest, Inc.
- Executive Premier Workshop
- One-Day Options Course
- OptionsPro
- Retirement Income Workshop
- Sure-Fire Trading Systems (VectorVest, Inc.)
- Trading as a Business Workshop
- VectorVest 7 EOD
- VectorVest 7 RealTime/IntraDay
- VectorVest AutoTester
- VectorVest Educational Services
- VectorVest OnLine
- VectorVest Options Analyzer
- VectorVest ProGraphics v6.0
- VectorVest ProTrader 7
- VectorVest RealTime Derby Tool
- VectorVest Simulator
- VectorVest Variator
- VectorVest Watchdog
