HOT TOPICS LIST
- MACD
- Fibonacci
- RSI
- Gann
- ADXR
- Stochastics
- Volume
- Triangles
- Futures
- Cycles
- Volatility
- ZIGZAG
- MESA
- Retracement
- Aroon
INDICATORS LIST
LIST OF TOPICS
PRINT THIS ARTICLE
by David Penn
Breakouts in oil stocks appear as the group moves toward a seasonal sweet spot.
Position: N/A
David Penn
Technical Writer for Technical Analysis of STOCKS & COMMODITIES magazine, Working-Money.com, and Traders.com Advantage.
PRINT THIS ARTICLE
SECTOR INVESTING
Black Gold Is Back
12/01/06 08:21:13 AMby David Penn
Breakouts in oil stocks appear as the group moves toward a seasonal sweet spot.
Position: N/A
| One of the more interesting sector seasonals noted by stock market historians Yale and Jeffrey Hirsch in their 2006 Stock Trader's Almanac is the six months' worth of outperformance that comes from the oil sector between mid-December and mid-June. Using the Amex Oil Index ($XOI) as their proxy and looking at average returns over both a 10- and five-year period, the Hirsches found that the $XOI had a 16.2% average return over the December–June period during the past 10 years and a 19% average return during that same time frame for the most recent five years. |

|
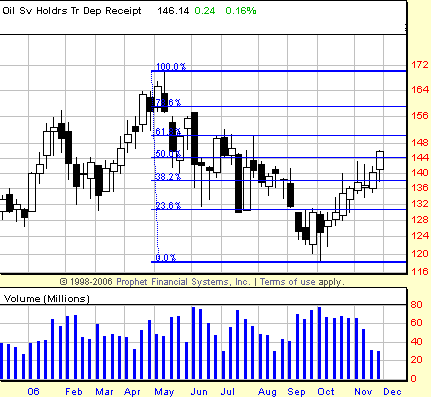
| FIGURE 1: OIL SERVICE HOLDRS, WEEKLY. After falling more than 26% from May to late September, oil service stocks rebounded strongly in the autumn, retracing fully 50% of the previous decline by late November. |
| Graphic provided by: Prophet Financial, Inc. |
| |
| At a time when many markets are overbought and traders and investors are anxiously awaiting any pullback in order to start buying, the prospect of a sector still coming off of a bottom and equipped with a compelling, bullish secular story is likely to be a welcome one. |
| Then again, it depends on your measuring tool. Compared to the $XOI, which is closing in on its 2006 highs, the oil service HOLDRS — along with many oil service stocks — are still just climbing above the 50% retracement level (Figure 1). In fact, as I review my watchlist of oil stocks, it seems that for every Conoco Phillips and Exxon that are at or above their 2006 highs, there are the Baker Hughes, the Halliburtons, and the TransOceans that are lagging. |

|
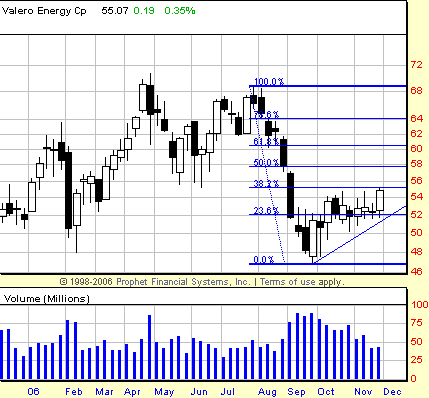
| FIGURE 2: VALERO ENERGY CORP., WEEKLY. Although oil stocks like Exxon are making 52-week highs, others such as Valero have yet to truly get moving to the upside. The stock's recent move toward the 38.2% retracement level will be one test of whether stocks like Valero will be a part of the group's overall move higher. |
| Graphic provided by: Prophet Financial, Inc. |
| |
| If there is to be a sustained move higher in these stocks over the next six months, then it is possible (if not likely) that those stocks that are nearing, at, or have recently notched 52-week highs will do some consolidating — as will those approaching the 50% retracement level — before moving higher. Insofar as oil stocks have yet to gain the attention of the investing public, any coming consolidation might be an ideal time for those interested in buying (or "renting") oil stocks to do so. |
| A stock like Valero is a good example of such stocks that have just started to get going. Looking at the weekly chart in Figure 2, it appears as if a sort of ascending triangle bottom has been developing since early October. In fact, there's an argument that the triangle is even larger and begins in late September (as the trendline in Figure 2 almost suggests). In either event (and taking the more modest case as our example), the triangle projects a move to the 58 area (formation size of 4 plus the breakout level at approximately 54). This 58 level would coincide with a full 50% retracement as well as with potential resistance left over from the lows of early summer. |
Technical Writer for Technical Analysis of STOCKS & COMMODITIES magazine, Working-Money.com, and Traders.com Advantage.
| Title: | Technical Writer |
| Company: | Technical Analysis, Inc. |
| Address: | 4757 California Avenue SW |
| Seattle, WA 98116 | |
| Phone # for sales: | 206 938 0570 |
| Fax: | 206 938 1307 |
| Website: | www.Traders.com |
| E-mail address: | DPenn@traders.com |
Traders' Resource Links | |
| Charting the Stock Market: The Wyckoff Method -- Books | |
| Working-Money.com -- Online Trading Services | |
| Traders.com Advantage -- Online Trading Services | |
| Technical Analysis of Stocks & Commodities -- Publications and Newsletters | |
| Working Money, at Working-Money.com -- Publications and Newsletters | |
| Traders.com Advantage -- Publications and Newsletters | |
| Professional Traders Starter Kit -- Software | |
Click here for more information about our publications!
Comments
Date: 12/03/06Rank: 3Comment:

Request Information From Our Sponsors
- StockCharts.com, Inc.
- Candle Patterns
- Candlestick Charting Explained
- Intermarket Technical Analysis
- John Murphy on Chart Analysis
- John Murphy's Chart Pattern Recognition
- John Murphy's Market Message
- MurphyExplainsMarketAnalysis-Intermarket Analysis
- MurphyExplainsMarketAnalysis-Visual Analysis
- StockCharts.com
- Technical Analysis of the Financial Markets
- The Visual Investor
- VectorVest, Inc.
- Executive Premier Workshop
- One-Day Options Course
- OptionsPro
- Retirement Income Workshop
- Sure-Fire Trading Systems (VectorVest, Inc.)
- Trading as a Business Workshop
- VectorVest 7 EOD
- VectorVest 7 RealTime/IntraDay
- VectorVest AutoTester
- VectorVest Educational Services
- VectorVest OnLine
- VectorVest Options Analyzer
- VectorVest ProGraphics v6.0
- VectorVest ProTrader 7
- VectorVest RealTime Derby Tool
- VectorVest Simulator
- VectorVest Variator
- VectorVest Watchdog
