HOT TOPICS LIST
- MACD
- Fibonacci
- RSI
- Gann
- ADXR
- Stochastics
- Volume
- Triangles
- Futures
- Cycles
- Volatility
- ZIGZAG
- MESA
- Retracement
- Aroon
INDICATORS LIST
LIST OF TOPICS
PRINT THIS ARTICLE
by Gary Grosschadl
It's wise to tread carefully when chart patterns and indicators diverge.
Position: Hold
Gary Grosschadl
Independent Canadian equities trader and technical analyst based in Peterborough
Ontario, Canada.
PRINT THIS ARTICLE
RISING TREND
Honeywell's Dubious Rising Channel
11/30/06 08:15:06 AMby Gary Grosschadl
It's wise to tread carefully when chart patterns and indicators diverge.
Position: Hold
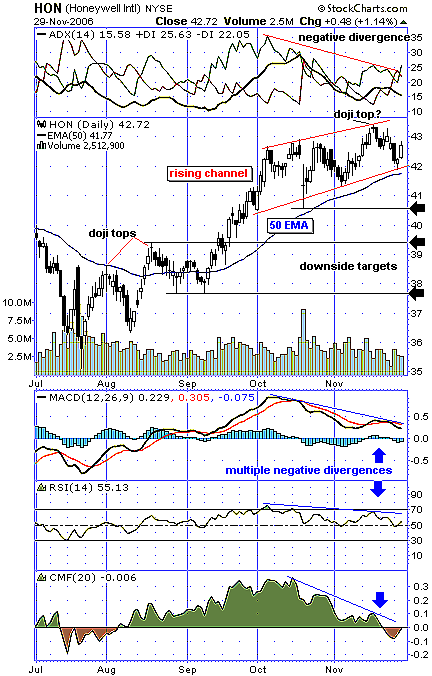
| Figure 1 shows a rising pattern off a hammer bottom last July. In the past two months the uptrend takes the shape of a rising channel. It also shows strength above the 50-day exponential moving average (EMA). But other indicators hint at weakness. |
| Note the small cross, which signifies a doji candlestick marking the top of this current formation. After an extended rise, a doji candle can signal a top. The cross depicts a similar open and close, which often points to a coming change in momentum as the bulls and bears appear to be in a stalemate. The previous August also shows two separate doji candlesticks, which marked interim tops leading to small downlegs. |

|
| FIGURE 1: HONEYWELL INTERNATIONAL, DAILY. Divergences cast doubt on this otherwise rising trend. |
| Graphic provided by: StockCharts.com. |
| |
| The worrisome factor is the presence of multiple negative divergences between price action and indicators. As the stock continued to make a higher peak the indicators went lower, failing to confirm higher price action. More often than not, multiple negative divergences are a precursor to a coming downleg. |
| The top of the chart shows a negative divergence between the +DI or the positive directional indicator and price action. Note the ADX line (average directional movement index) is also lower, indicating a weakening trend. The indicators below the chart also show their own negative divergences via the MACD (moving average convergence/divergence), the RSI (relative strength index), and the CMF (Chaikin money flow indicator). This last indicator shows that buying power is drying up severely. If most of the bulls have left, who will drive the price higher? |
| Should a downleg develop, three lower targets are mused relating to specific points of previous support or resistance at 40.60, 39.40, and 37.60. First we need to see 50-day EMA support fail, that being the most likely trigger for more downside weakness. But for now the bulls have dubious control as long as this rising channel holds true to form. |
Independent Canadian equities trader and technical analyst based in Peterborough
Ontario, Canada.
| Website: | www.whatsonsale.ca/financial.html |
| E-mail address: | gwg7@sympatico.ca |
Click here for more information about our publications!
Comments
Date: 12/03/06Rank: 5Comment:

Request Information From Our Sponsors
- StockCharts.com, Inc.
- Candle Patterns
- Candlestick Charting Explained
- Intermarket Technical Analysis
- John Murphy on Chart Analysis
- John Murphy's Chart Pattern Recognition
- John Murphy's Market Message
- MurphyExplainsMarketAnalysis-Intermarket Analysis
- MurphyExplainsMarketAnalysis-Visual Analysis
- StockCharts.com
- Technical Analysis of the Financial Markets
- The Visual Investor
- VectorVest, Inc.
- Executive Premier Workshop
- One-Day Options Course
- OptionsPro
- Retirement Income Workshop
- Sure-Fire Trading Systems (VectorVest, Inc.)
- Trading as a Business Workshop
- VectorVest 7 EOD
- VectorVest 7 RealTime/IntraDay
- VectorVest AutoTester
- VectorVest Educational Services
- VectorVest OnLine
- VectorVest Options Analyzer
- VectorVest ProGraphics v6.0
- VectorVest ProTrader 7
- VectorVest RealTime Derby Tool
- VectorVest Simulator
- VectorVest Variator
- VectorVest Watchdog
