HOT TOPICS LIST
- MACD
- Fibonacci
- RSI
- Gann
- ADXR
- Stochastics
- Volume
- Triangles
- Futures
- Cycles
- Volatility
- ZIGZAG
- MESA
- Retracement
- Aroon
INDICATORS LIST
LIST OF TOPICS
PRINT THIS ARTICLE
by David Penn
Waiting for signs of directionality as the semiconductor HOLDRS works its way through a potential 1-2-3 trend reversal setup.
Position: N/A
David Penn
Technical Writer for Technical Analysis of STOCKS & COMMODITIES magazine, Working-Money.com, and Traders.com Advantage.
PRINT THIS ARTICLE
REVERSAL
Sideways Semiconductors
11/30/06 08:27:11 AMby David Penn
Waiting for signs of directionality as the semiconductor HOLDRS works its way through a potential 1-2-3 trend reversal setup.
Position: N/A
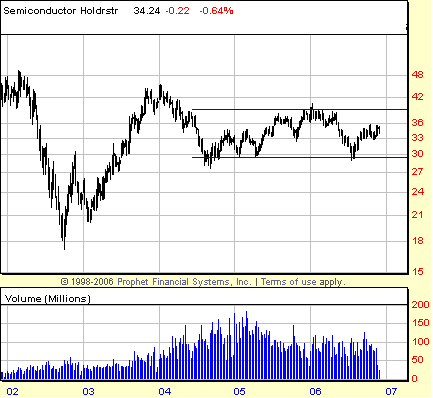
| From a certain, long-term perspective, semiconductor stocks have been in a bear market since the first weeks of 2004. See Figure 1. |

|
| FIGURE 1: SEMICONDUCTOR HOLDRS, WEEKLY. The largely sideways movement in SMH has provided precious few intermediate-term trading opportunities in semiconductor stocks. |
| Graphic provided by: Prophet Financial, Inc. |
| |
| To be sure, it has been one of those sideways bear markets that have provided enough strong rallies and clear declines to keep traders and investors interested in semiconductor stocks. After peaking at 45 in earliest 2004, the semiconductor HOLDRS (SMH) fell to a low of about 27 by September 2004. Slowly and fitfully, the SMH rallied to a little more than 39 in the first weeks of 2006. Since then, semiconductors have moved downward, slipping back below 30 in the summer of 2006 before bouncing back up to the 36 level by autumn. |
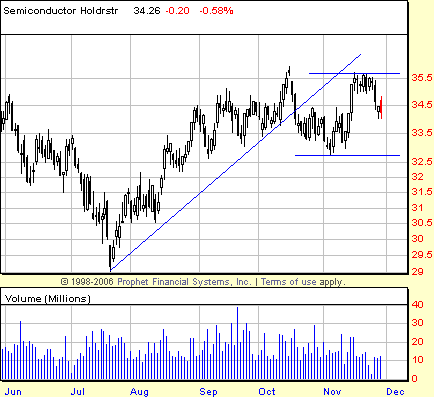
| Traders and investors looking at semiconductor stocks in late 2006 can see the immediate context as an uptrend from a bottom just south of 30. From the point of view of the last few months, it appears as if a nascent bull market in semiconductor stocks has run into its first significant correction but managed to find support near the 32.50 level. At the same time, however, we can see through the lens of the 1-2-3 trend reversal that semiconductor stocks are in every bit of a precarious position as their longer-term bear market (the one that began in 2004) might suggest. The SMH has broken down below the main July–October trendline (the "1" in the 1-2-3 trend reversal) and failed to restore the previous trend with a new high in November (the "2" in the 1-2-3 trend reversal). All that remains is to see if, following that failure, the SMH will take out the post-trendline break low near 32.5. This would represent the "3" of the 1-2-3 trend reversal and set the stage for a larger correction than has been the case so far. |

|
| FIGURE 2: SEMICONDUCTOR HOLDRS, DAILY. Two steps through a 1-2-3 trend reversal, a close below the November lows will mark the completion of the third stage of the 1-2-3 trend reversal and, potentially, a test of the year-to-date lows. |
| Graphic provided by: Prophet Financial, Inc. |
| |
| Failure to find support near the 32.50 level could have serious repercussions for semiconductor stocks. The SMH chart in Figure 2 shows a consolidation pattern that began in September, one that measures approximately three points at its widest point in October. Should the SMH break down below 32.50, then those same three points would most likely be subtracted from the consolidation low of 32.50 in order to produce a downside target of about 29.5. Such a decline, clearly, would find the SMH retracing the entirety of its July–October advance and seriously test the 2006 lows. |
| The same consolidation, of course, could be used to project an upside to the 37.5–38 area should the SMH break out rather than break down. A rally to that area would find itself meeting stiff resistance insofar as that level marks the spring 2006 highs in SMH (the 2006 high extends to about 40.5). Certainly any breakout beyond that level would be exceptionally bullish for semiconductors, just as the violation of the 2006 lows would be exceptionally bearish. |
Technical Writer for Technical Analysis of STOCKS & COMMODITIES magazine, Working-Money.com, and Traders.com Advantage.
| Title: | Technical Writer |
| Company: | Technical Analysis, Inc. |
| Address: | 4757 California Avenue SW |
| Seattle, WA 98116 | |
| Phone # for sales: | 206 938 0570 |
| Fax: | 206 938 1307 |
| Website: | www.Traders.com |
| E-mail address: | DPenn@traders.com |
Traders' Resource Links | |
| Charting the Stock Market: The Wyckoff Method -- Books | |
| Working-Money.com -- Online Trading Services | |
| Traders.com Advantage -- Online Trading Services | |
| Technical Analysis of Stocks & Commodities -- Publications and Newsletters | |
| Working Money, at Working-Money.com -- Publications and Newsletters | |
| Traders.com Advantage -- Publications and Newsletters | |
| Professional Traders Starter Kit -- Software | |
Click here for more information about our publications!
Comments
Date: 11/30/06Rank: 3Comment:

Request Information From Our Sponsors
- StockCharts.com, Inc.
- Candle Patterns
- Candlestick Charting Explained
- Intermarket Technical Analysis
- John Murphy on Chart Analysis
- John Murphy's Chart Pattern Recognition
- John Murphy's Market Message
- MurphyExplainsMarketAnalysis-Intermarket Analysis
- MurphyExplainsMarketAnalysis-Visual Analysis
- StockCharts.com
- Technical Analysis of the Financial Markets
- The Visual Investor
- VectorVest, Inc.
- Executive Premier Workshop
- One-Day Options Course
- OptionsPro
- Retirement Income Workshop
- Sure-Fire Trading Systems (VectorVest, Inc.)
- Trading as a Business Workshop
- VectorVest 7 EOD
- VectorVest 7 RealTime/IntraDay
- VectorVest AutoTester
- VectorVest Educational Services
- VectorVest OnLine
- VectorVest Options Analyzer
- VectorVest ProGraphics v6.0
- VectorVest ProTrader 7
- VectorVest RealTime Derby Tool
- VectorVest Simulator
- VectorVest Variator
- VectorVest Watchdog
