HOT TOPICS LIST
- MACD
- Fibonacci
- RSI
- Gann
- ADXR
- Stochastics
- Volume
- Triangles
- Futures
- Cycles
- Volatility
- ZIGZAG
- MESA
- Retracement
- Aroon
INDICATORS LIST
LIST OF TOPICS
PRINT THIS ARTICLE
by Koos van der Merwe
Every morning I look for certain stocks to buy, but they have to meet certain parameters. What does it mean if for the past three days, not a single stock has come up that meets those parameters?
Position: Sell
Koos van der Merwe
Has been a technical analyst since 1969, and has worked as a futures and options trader with First Financial Futures in Johannesburg, South Africa.
PRINT THIS ARTICLE
ELLIOTT WAVE
Meeting Parameters On The S&P 500
11/29/06 02:39:08 PMby Koos van der Merwe
Every morning I look for certain stocks to buy, but they have to meet certain parameters. What does it mean if for the past three days, not a single stock has come up that meets those parameters?
Position: Sell
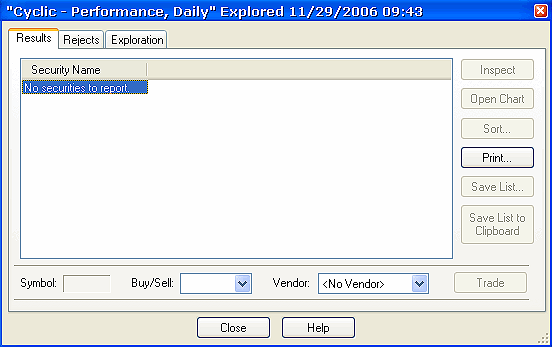
| Every morning I run an exploration on the New York, AMEX, NASDAQ, and Toronto markets to look for stocks to buy. These stocks must meet certain parameters. For the past three days, not one stock has come up. This is unusual, and I ask, what is this telling me? Figure 1 shows my final exploration result. |

|
| FIGURE 1: PERFORMANCE EXPLORATION REPORT. Not one stock has popped up with the parameters I was searching for—what's that mean? |
| Graphic provided by: MetaStock. |
| |
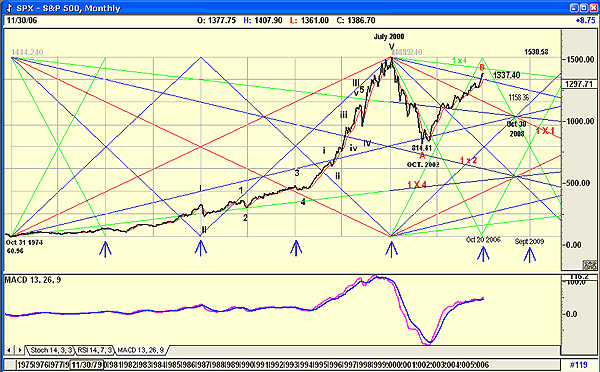
| This suggests that the correction we have been anticipating could be under way. Figure 2, the S&P 500 monthly chart, shows that the index could be topping out in a B-wave. |

|
| FIGURE 2: ELLIOTT WAVE AND GANN FANN OF THE S&P 500, MONTHLY. Could the index be topping out in a B-wave? |
| Graphic provided by: AdvancedGET. |
| |
| I first introduced this chart on September 22, 2005. At that time the chart suggested that 2006 would truly be a year of misfortune for the market. It is now November 2006, and the chart shows that the index is still rising. The first rule in Elliott wave analysis is the chart must look right. In this case, the chart looks very right. The fifth wave top was the bubble of 2000. The index then fell in an A-wave, and has now recovered in a B-wave. |
| B-waves are not impulse waves, usually rising in an abc formation (not shown). B-wave tops are also difficult to predict. I have seen instances where B-waves have exceeded fifth wave tops. This usually suggests that the C-wave correction will not be that severe. The Gann cycle, which correctly forecast previous corrections (blue arrows), suggested a turning point on October 20. This as we know has not happened, although we should allow a two-month error on either side of the cyclical projection. The B-wave has also broken above the suggested target of 1337.40, one of Gann's rule of 8's lines. This suggests that the index could rise to the green 1x4 Gann line. |
Has been a technical analyst since 1969, and has worked as a futures and options trader with First Financial Futures in Johannesburg, South Africa.
| Address: | 3256 West 24th Ave |
| Vancouver, BC | |
| Phone # for sales: | 6042634214 |
| E-mail address: | petroosp@gmail.com |
Click here for more information about our publications!
Comments
Date: 11/29/06Rank: 2Comment:
Date: 12/05/06Rank: 5Comment:

Request Information From Our Sponsors
- StockCharts.com, Inc.
- Candle Patterns
- Candlestick Charting Explained
- Intermarket Technical Analysis
- John Murphy on Chart Analysis
- John Murphy's Chart Pattern Recognition
- John Murphy's Market Message
- MurphyExplainsMarketAnalysis-Intermarket Analysis
- MurphyExplainsMarketAnalysis-Visual Analysis
- StockCharts.com
- Technical Analysis of the Financial Markets
- The Visual Investor
- VectorVest, Inc.
- Executive Premier Workshop
- One-Day Options Course
- OptionsPro
- Retirement Income Workshop
- Sure-Fire Trading Systems (VectorVest, Inc.)
- Trading as a Business Workshop
- VectorVest 7 EOD
- VectorVest 7 RealTime/IntraDay
- VectorVest AutoTester
- VectorVest Educational Services
- VectorVest OnLine
- VectorVest Options Analyzer
- VectorVest ProGraphics v6.0
- VectorVest ProTrader 7
- VectorVest RealTime Derby Tool
- VectorVest Simulator
- VectorVest Variator
- VectorVest Watchdog
