

HOT TOPICS LIST
- MACD
- Fibonacci
- RSI
- Gann
- ADXR
- Stochastics
- Volume
- Triangles
- Futures
- Cycles
- Volatility
- ZIGZAG
- MESA
- Retracement
- Aroon
INDICATORS LIST
LIST OF TOPICS
PRINT THIS ARTICLE
by Arthur Hill
Silicon Labs has consolidated over the last few months, and signs of accumulation within this consolidation favor an upside breakout.
Position: Accumulate
Arthur Hill
Arthur Hill is currently editor of TDTrader.com, a website specializing in trading strategies, sector/industry specific breadth stats and overall technical analysis. He passed the Society of Technical Analysts (STA London) diploma exam with distinction is a Certified Financial Technician (CFTe). Prior to TD Trader, he was the Chief Technical Analyst for Stockcharts.com and the main contributor to the ChartSchool.
PRINT THIS ARTICLE
ACCUM./DIST. CHAIKIN
Signs Of Accumulation For Silicon Labs
11/29/06 01:49:43 PMby Arthur Hill
Silicon Labs has consolidated over the last few months, and signs of accumulation within this consolidation favor an upside breakout.
Position: Accumulate
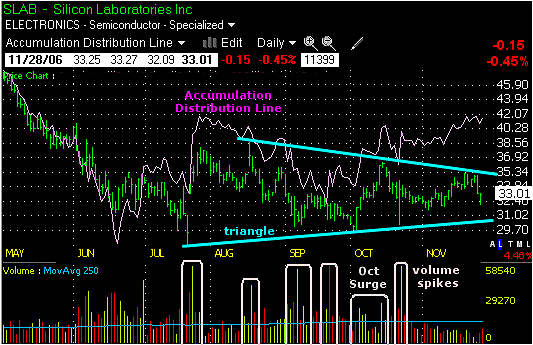
| On Figure 1, Silicon Labs (SLAB) declined sharply from April to July and then formed a large triangle over the last three and a half months. The triangle features lower highs and higher lows as prices contracted from late July. The continuous contraction shows a tightening battle between bull and bears. A breakout from the triangle will reveal the victor and set the stage for the next move. Look for a break above 36 to turn bullish and a break below 30 to turn bearish. |
|
| FIGURE 1: SILICON LABS, DAILY. SLAB declined sharply from April to July and then formed a large triangle over the last three and a half months. |
| Graphic provided by: TC2000.com. |
| Graphic provided by: Telechart 2007. |
| |
| Volume within the triangle favors the bulls. There were six big volume spikes from late July to late November. Four were on up days and one was on a down day. In addition, the stock surged in early October with above-average volume. The most recent volume spike occurred on October 23 when the stock opened below 31 and closed above 33.5. This reversal day shows strong buying and solidifies support around 30–31. |
| Taking volume one step further, the accumulation distribution line shows steady buying pressure. This volume-based indicator is based on the close relative to the high–low range. A close above the midpoint of the high–low range is positive and shows signs of accumulation. A close below the midpoint is negative and shows distribution. The indicator bottomed in mid-June, formed a higher low in September, and is now challenging its July high. Moreover, the accumulation distribution line moved higher from mid-September to late November and shows signs of accumulation. This increases the odds of an upside breakout, and traders should watch triangle resistance closely in the next few days and weeks. |
Arthur Hill is currently editor of TDTrader.com, a website specializing in trading strategies, sector/industry specific breadth stats and overall technical analysis. He passed the Society of Technical Analysts (STA London) diploma exam with distinction is a Certified Financial Technician (CFTe). Prior to TD Trader, he was the Chief Technical Analyst for Stockcharts.com and the main contributor to the ChartSchool.
| Title: | Editor |
| Company: | TDTrader.com |
| Address: | Willem Geetsstraat 17 |
| Mechelen, B2800 | |
| Phone # for sales: | 3215345465 |
| Website: | www.tdtrader.com |
| E-mail address: | arthurh@tdtrader.com |
Traders' Resource Links | |
| TDTrader.com has not added any product or service information to TRADERS' RESOURCE. | |
Click here for more information about our publications!
Comments
Date:�11/29/06Rank:�4Comment:�

Request Information From Our Sponsors
- VectorVest, Inc.
- Executive Premier Workshop
- One-Day Options Course
- OptionsPro
- Retirement Income Workshop
- Sure-Fire Trading Systems (VectorVest, Inc.)
- Trading as a Business Workshop
- VectorVest 7 EOD
- VectorVest 7 RealTime/IntraDay
- VectorVest AutoTester
- VectorVest Educational Services
- VectorVest OnLine
- VectorVest Options Analyzer
- VectorVest ProGraphics v6.0
- VectorVest ProTrader 7
- VectorVest RealTime Derby Tool
- VectorVest Simulator
- VectorVest Variator
- VectorVest Watchdog
- StockCharts.com, Inc.
- Candle Patterns
- Candlestick Charting Explained
- Intermarket Technical Analysis
- John Murphy on Chart Analysis
- John Murphy's Chart Pattern Recognition
- John Murphy's Market Message
- MurphyExplainsMarketAnalysis-Intermarket Analysis
- MurphyExplainsMarketAnalysis-Visual Analysis
- StockCharts.com
- Technical Analysis of the Financial Markets
- The Visual Investor