HOT TOPICS LIST
- MACD
- Fibonacci
- RSI
- Gann
- ADXR
- Stochastics
- Volume
- Triangles
- Futures
- Cycles
- Volatility
- ZIGZAG
- MESA
- Retracement
- Aroon
INDICATORS LIST
LIST OF TOPICS
PRINT THIS ARTICLE
by David Penn
A classic chart pattern suggests bullish times for bonds.
Position: N/A
David Penn
Technical Writer for Technical Analysis of STOCKS & COMMODITIES magazine, Working-Money.com, and Traders.com Advantage.
PRINT THIS ARTICLE
CUP WITH HANDLE
A Cup With Handle For Treasury Notes
11/29/06 01:41:41 PMby David Penn
A classic chart pattern suggests bullish times for bonds.
Position: N/A
| It has become a popular refrain in financial circles that stocks are behaving as if the best is yet to come, while bonds are, to put it mildly, less than enthusiastic. This divergence of sorts has contributed to the bull market in stocks, no doubt providing a steady measure of the requisite doubt and disbelief that powers equities markets higher. |

|
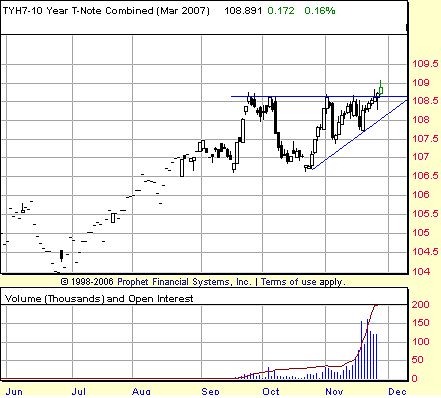
| FIGURE 1: MARCH 2007 10-YEAR TREASURY NOTE FUTURES, DAILY. Over the course of October and November, the March 10-year has traced out an ascending triangle that anticipates an initial move to as high as 110.5 should the breakout hold. |
| Graphic provided by: Prophet Financial, Inc. |
| |
| We can easily see how stocks are pricing in a positive future by dint of the rally they've experienced since the summer of 2006. But how can we tell there are nervous nellies in the bond market? The evidence, apparently, is in the bullishness of the bond market itself. Bull markets in bonds often reflect a decline in inflationary expectations. But they also suggest a fear that the absence of inflation might be signaling flagging economic growth. As such, investors move toward the relative security of the coupon (that is, the interest rate) that bonds provide. |
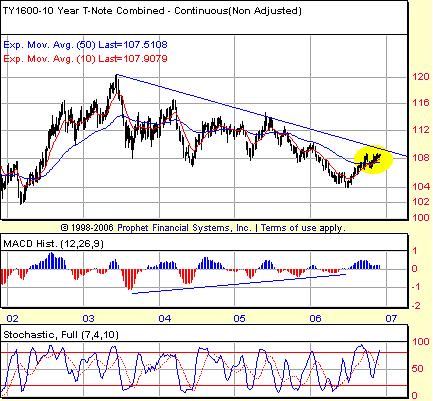
| The current vehicle of the 10-year's ascent appears to be an ascending triangle (Figure 1). The 10-year Treasury note bottomed in the summer of 2006, the low point of a largely sideways bear market in bonds that began back in the summer of 2003 that saw the 10-year slip from 120 to 104 (basis continuous futures, Figure 2). Since that 2006 bottom, the 10-year has been moving steadily higher, making higher monthly lows up to and including November. It is in the immediate context of these higher lows that we need to consider the ascending triangle that has contained the March 10-year note's price action over the past two months. This is because, generally speaking, consolidations in trends tend to lead to more of a trend rather than a reversal. |

|
| FIGURE 2: CONTINUOUS 10-YEAR TREASURY NOTE FUTURES, WEEKLY. Taking a longer-term view, it is clear that the current rally in bonds is the market's latest attempt to buck a three-year bear market. |
| Graphic provided by: Prophet Financial, Inc. |
| |
| Most of my daily screens have already given buy signals in the March 2007 T-note. The earliest buy signal came from the directional movement/ADX (average directional movement index) screen that produced a buy signal on October 26 just as the TYH7 closed above the 20-day exponential moving average (EMA) that was filled the following day. The histochastic screen (which relies on the moving average convergence/divergence [MACD] histogram) produced a buy signal on November 17 at 108.74 that wasn't filled until November 24. Two later signals, from TRIX on November 20 and the BOSO screen on November 21, both at an entry point of 108.50, were filled the day after the respective signals (November 21 for the TRIX, November 22 for BOSO). As of this writing, all are profitable trades. |
| And there may be more profit to come. The ascending triangle shown in Figure 1 projects to the 110.5 area as an initial upside target. This would force a test of that long-term downtrend line, one that reflects the 2003–06 bear market in the 10-year. Successful penetration of this trendline, with the support of the increasingly upward 10- and 50-week EMA, could be the beginning of a significant reversal of fortunes for the bond market. |
Technical Writer for Technical Analysis of STOCKS & COMMODITIES magazine, Working-Money.com, and Traders.com Advantage.
| Title: | Technical Writer |
| Company: | Technical Analysis, Inc. |
| Address: | 4757 California Avenue SW |
| Seattle, WA 98116 | |
| Phone # for sales: | 206 938 0570 |
| Fax: | 206 938 1307 |
| Website: | www.Traders.com |
| E-mail address: | DPenn@traders.com |
Traders' Resource Links | |
| Charting the Stock Market: The Wyckoff Method -- Books | |
| Working-Money.com -- Online Trading Services | |
| Traders.com Advantage -- Online Trading Services | |
| Technical Analysis of Stocks & Commodities -- Publications and Newsletters | |
| Working Money, at Working-Money.com -- Publications and Newsletters | |
| Traders.com Advantage -- Publications and Newsletters | |
| Professional Traders Starter Kit -- Software | |
Click here for more information about our publications!
Comments
Date: 11/29/06Rank: 3Comment:

Request Information From Our Sponsors
- VectorVest, Inc.
- Executive Premier Workshop
- One-Day Options Course
- OptionsPro
- Retirement Income Workshop
- Sure-Fire Trading Systems (VectorVest, Inc.)
- Trading as a Business Workshop
- VectorVest 7 EOD
- VectorVest 7 RealTime/IntraDay
- VectorVest AutoTester
- VectorVest Educational Services
- VectorVest OnLine
- VectorVest Options Analyzer
- VectorVest ProGraphics v6.0
- VectorVest ProTrader 7
- VectorVest RealTime Derby Tool
- VectorVest Simulator
- VectorVest Variator
- VectorVest Watchdog
- StockCharts.com, Inc.
- Candle Patterns
- Candlestick Charting Explained
- Intermarket Technical Analysis
- John Murphy on Chart Analysis
- John Murphy's Chart Pattern Recognition
- John Murphy's Market Message
- MurphyExplainsMarketAnalysis-Intermarket Analysis
- MurphyExplainsMarketAnalysis-Visual Analysis
- StockCharts.com
- Technical Analysis of the Financial Markets
- The Visual Investor
