HOT TOPICS LIST
- MACD
- Fibonacci
- RSI
- Gann
- ADXR
- Stochastics
- Volume
- Triangles
- Futures
- Cycles
- Volatility
- ZIGZAG
- MESA
- Retracement
- Aroon
INDICATORS LIST
LIST OF TOPICS
PRINT THIS ARTICLE
by Paolo Pezzutti
Prices are engaged in a very long congestion. The breakout should develop a volatile and directional move in the short term.
Position: N/A
Paolo Pezzutti
Author of the book "Trading the US Markets - A Comprehensive Guide to US Markets for International Traders and Investors" - Harriman House (July 2008)
PRINT THIS ARTICLE
TECHNICAL ANALYSIS
Bristol Myers Squibb And The Long Congestion
11/29/06 02:04:11 PMby Paolo Pezzutti
Prices are engaged in a very long congestion. The breakout should develop a volatile and directional move in the short term.
Position: N/A
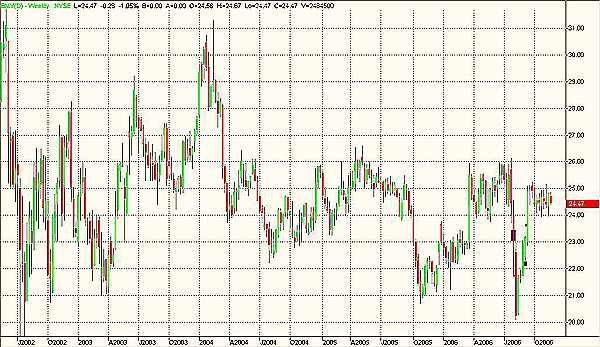
| Bristol Myers Squibb (BMY), the pharmaceutical company, is printing a series of interesting formations from the chart perspective. First of all, to understand the general market conditions, you can see in Figure 1 that during the past four years, BMY has been oscillating between the levels of $20-21 and $30-31. The moves have been characterized by very big swings without a long-term clear direction. |

|
| FIGURE 1: BMY, WEEKLY. The stock in the intermediate term has been printing big swings without a defined direction. |
| Graphic provided by: TradeStation. |
| |
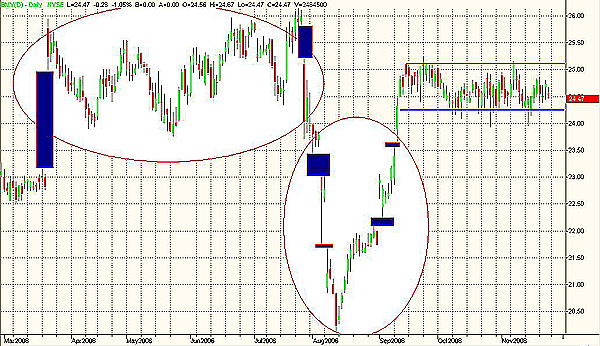
| In the daily time frame in Figure 2, note that the stock has first printed an island at the top between March and July and then another island, this time at the bottom between July and September 2006. You have an island top when prices gap higher after an advance, trade for some time leaving the gap open, then gap lower. After the upward exhaustion gap has formed, prices can develop a trading range before the gap to the downside is printed. The two gaps leave the trading range area like an island. The exhaustion gap to the upside is followed by a breakaway gap to the downside, and it indicates a trend reversal unless the breakaway gap is filled soon. The opposite is true for island bottoms. Islands can provide profitable indications, although the emotional participation of the public in the development of the pattern makes this pattern characterized by high volatility. Traders have to be prepared to trade in a volatile environment. False signals can occur. Before you open a trade, you might want to wait and see if the second gap gets filled. This will reduce your risk, of course, but also the profit opportunity. |
| Going back to the chart after the top reversal island, prices moved fast to the downside printing an impulse and two down gaps. The stock lost more than 20% of its value in 12 sessions. Never say never in the markets, however. After what seemed the beginning of a steep fall, suddenly the technical situation changed completely. You can see, in fact, that an island bottom was developed between July and September. The formation is interesting graphically and actually quite rare. You have two down gaps and two up gaps forming a symmetrical island. Prices after the island at the bottom have moved fast to the upside. |

|
| FIGURE 2: BMY, DAILY. After printing a bearish reversal island followed by a bullish island, the stock is now developing at an unusually long congestion area. An expansion in volatility and a new trend should emerge soon. |
| Graphic provided by: TradeStation. |
| |
| Since mid-September, another interesting formation has started to develop. Prices have remained trapped between the two islands without managing to take a clear direction. The high-volatility environment did not turn out to develop a clear directional trend. The stock has developed an ongoing congestion. It is quite rare to see these moves last for such a long time. Already, 52 bars have been printed within the congestion area. Normally, you can see about up to 30 bars. In this situation of low volatility, however, common also to several other stocks, the Bollinger BandWidth indicator is printing extremely low values, which were not seen since August 2005. You know that the indicator is calculated subtracting the lower band from the upper band and then normalizing the result, after you divide it by the middle band. When the bands get very narrow, you can expect a sharp expansion in volatility and a trend in the near future. Bollinger defined the squeeze pattern that is triggered when BandWidth falls to its lowest level in the past six months. |
| It is difficult and risky to anticipate the direction of the breakout, and that is why the advice in this situation of prolonged congestion is to apply a breakout technique to exploit the increase in volatility and directionality that should occur in the short term. |
Author of the book "Trading the US Markets - A Comprehensive Guide to US Markets for International Traders and Investors" - Harriman House (July 2008)
| Address: | VIA ROBERTO AGO 26 POSTAL CODE 00166 |
| Rome, ITALY | |
| Phone # for sales: | +393357540708 |
| E-mail address: | pezzutti.paolo@tiscali.it |
Click here for more information about our publications!
Comments
Date: 11/29/06Rank: 3Comment:

Request Information From Our Sponsors
- StockCharts.com, Inc.
- Candle Patterns
- Candlestick Charting Explained
- Intermarket Technical Analysis
- John Murphy on Chart Analysis
- John Murphy's Chart Pattern Recognition
- John Murphy's Market Message
- MurphyExplainsMarketAnalysis-Intermarket Analysis
- MurphyExplainsMarketAnalysis-Visual Analysis
- StockCharts.com
- Technical Analysis of the Financial Markets
- The Visual Investor
- VectorVest, Inc.
- Executive Premier Workshop
- One-Day Options Course
- OptionsPro
- Retirement Income Workshop
- Sure-Fire Trading Systems (VectorVest, Inc.)
- Trading as a Business Workshop
- VectorVest 7 EOD
- VectorVest 7 RealTime/IntraDay
- VectorVest AutoTester
- VectorVest Educational Services
- VectorVest OnLine
- VectorVest Options Analyzer
- VectorVest ProGraphics v6.0
- VectorVest ProTrader 7
- VectorVest RealTime Derby Tool
- VectorVest Simulator
- VectorVest Variator
- VectorVest Watchdog
