HOT TOPICS LIST
- MACD
- Fibonacci
- RSI
- Gann
- ADXR
- Stochastics
- Volume
- Triangles
- Futures
- Cycles
- Volatility
- ZIGZAG
- MESA
- Retracement
- Aroon
INDICATORS LIST
LIST OF TOPICS
PRINT THIS ARTICLE
by Dominick Mazza
Is silver invalidating the perfect triangle? It appears so.
Position: N/A
Dominick Mazza
Analyst and founder of www.tradingthecharts.com. The website specializes in technical approaches to commodities markets using Elliott wave, Fibonacci, cycles and proprietary indicators.
PRINT THIS ARTICLE
TECHNICAL ANALYSIS
Silver Breaks Triangle Pattern
11/29/06 12:15:03 PMby Dominick Mazza
Is silver invalidating the perfect triangle? It appears so.
Position: N/A
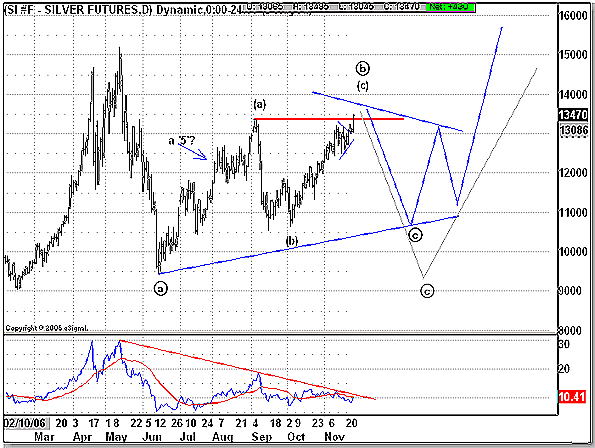
| Figure 1 shows silver breaking through and invalidating the perfect triangle that many traders and analysts have been following, but which I had been expecting. The first hint was that wave (a) looked like a five-wave advance. In contracting triangles, the five waves within it must be composed of three wave structures. Now, both my waves (a) and (c) are five-wave structures, as I would want them to form the circled b wave. My indicator shows resistance at this price area and, as Elliott wave theory traders take notice, I would expect to see silver turn and drop. When the (c) wave high is established, silver will fall to either a new low under 1000 or somewhere above it if it follows our preferred larger triangle pattern. |
| However the pattern unfolds there's a silver lining at the end of either forecast, and silver should explode from these levels. There's no indication that the market is ready to turn down yet and, as a matter of fact, it still looks like it could go higher. But once it does reverse, there is a nice short trade available. |

|
| FIGURE 1: SILVER. The move above the red trendline invalidates the triangle. |
| Graphic provided by: eSignal. |
| |
Analyst and founder of www.tradingthecharts.com. The website specializes in technical approaches to commodities markets using Elliott wave, Fibonacci, cycles and proprietary indicators.
| Website: | www.tradingthecharts.com |
Click here for more information about our publications!
Comments
Date: 11/29/06Rank: 2Comment:

Request Information From Our Sponsors
- StockCharts.com, Inc.
- Candle Patterns
- Candlestick Charting Explained
- Intermarket Technical Analysis
- John Murphy on Chart Analysis
- John Murphy's Chart Pattern Recognition
- John Murphy's Market Message
- MurphyExplainsMarketAnalysis-Intermarket Analysis
- MurphyExplainsMarketAnalysis-Visual Analysis
- StockCharts.com
- Technical Analysis of the Financial Markets
- The Visual Investor
- VectorVest, Inc.
- Executive Premier Workshop
- One-Day Options Course
- OptionsPro
- Retirement Income Workshop
- Sure-Fire Trading Systems (VectorVest, Inc.)
- Trading as a Business Workshop
- VectorVest 7 EOD
- VectorVest 7 RealTime/IntraDay
- VectorVest AutoTester
- VectorVest Educational Services
- VectorVest OnLine
- VectorVest Options Analyzer
- VectorVest ProGraphics v6.0
- VectorVest ProTrader 7
- VectorVest RealTime Derby Tool
- VectorVest Simulator
- VectorVest Variator
- VectorVest Watchdog
