HOT TOPICS LIST
- MACD
- Fibonacci
- RSI
- Gann
- ADXR
- Stochastics
- Volume
- Triangles
- Futures
- Cycles
- Volatility
- ZIGZAG
- MESA
- Retracement
- Aroon
INDICATORS LIST
LIST OF TOPICS
PRINT THIS ARTICLE
by David Penn
A 2B top is in the making as the corn bull market begins a well-deserved break.
Position: N/A
David Penn
Technical Writer for Technical Analysis of STOCKS & COMMODITIES magazine, Working-Money.com, and Traders.com Advantage.
PRINT THIS ARTICLE
CONSOLID FORMATION
The Corn Correction
11/22/06 10:01:44 AMby David Penn
A 2B top is in the making as the corn bull market begins a well-deserved break.
Position: N/A
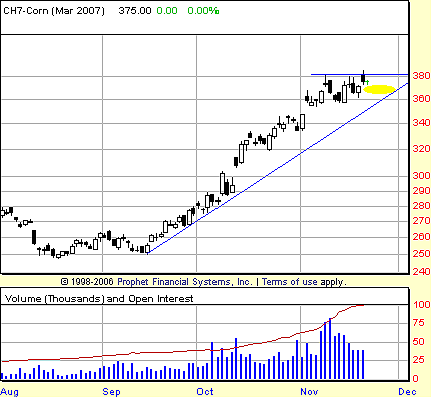
| Since September 2006, few other markets have moved with the bullish aplomb of corn futures. Trading down to $2.50 cents in mid-September, corn futures (basis March 2007) soared over the next several weeks, closing September just shy of $2.80 (each cent in a corn futures contract is worth $50, so that 30-cent move was worth approximately $1,500 per contract for those fortunate enough to be along for the ride). But if September represented a ride on the corn express, October was something more along the lines of warp drive, as a corn contract that began the month near $2.80 closed the month just shy of $3.40. |

|
| FIGURE 1: MARCH 2007 CORN FUTURES, DAILY. A 2B top in November requires March corn prices to fall back into the area highlighted by the oval, an area that corresponds to the low of the initial high 10 days earlier. The 20-cent consolidation between $3.80 and $3.60 suggests a move to $3.40 — where there is some measure of support — should corn break down from here. |
| Graphic provided by: Prophet Financial, Inc. |
| |
| Moving into November, however, the advance in corn has slowed. It appears that corn has begun to settle into a consolidation, giving the market time to digest the previous advance. Note how March corn pulled away in mid-October from its major trendline from the September bottom. That represents the acceleration in the trend, the sweet spot where the biggest gains were made. It now seems clear that March corn is headed back toward that major trendline where traders will be vigilant for signs of support. See Figure 1. |
| The biggest threat to that support is the emergence of a 2B top, or at least the beginnings of one. The 2B top occurs when a market makes a high, pulls back, makes a higher high, then fails to follow through on the upside after the higher high. It is, as Victor Sperandeo notes in his book Trader Vic: Methods Of A Wall Street Master, one of the best ways for catching an early reversal in trend. What is important, however, is that the trader be quick to concede the loss if the market in a 2B top exceeds the higher high. |

|
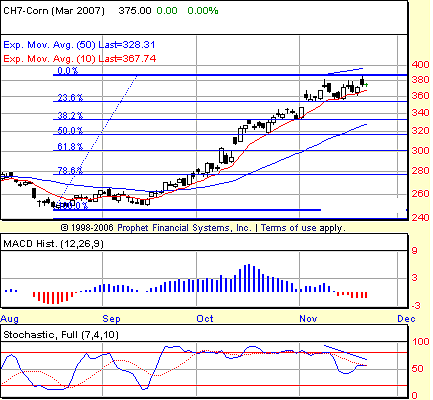
| FIGURE 2: MARCH 2007 CORN FUTURES, DAILY. A short-term negative divergence in the stochastic contributes to the idea that corn is entering correction mode. First support lies at the Fibonacci level of 23.6%, with more substantial support at the 38.2% level near $3.33. |
| Graphic provided by: Prophet Financial, Inc. |
| |
| Figure 2 shows some additional clues that March corn's next move might be downward. Specifically, I'm referring to the negative divergence in the stochastic oscillator, which suggests a loss of momentum to the upside. The moving average convergence/divergence (MACD) histogram shows similar deterioration in the advance. Neither indicator, it must be added, goes so far as to suggest a reversal in trend. But it seems clear that some sort of slowdown is likely. |
| For the aggressive traders, what are some short-side entry targets? I mentioned the highlighted oval area shown in Figure 1 as a general area to which prices must fall before the 2B top can be considered to be confirmed. A more exacting target would be $3.70, one cent below the initial, November 8 high. Using the MACD histogram to provide a trigger (the histochastic method I've referred to in previous pieces) is still problematic. While the stochastic has formed the requisite second lower peak and turned down, the MACD histogram has not yet turned down and has been becoming "less negative" over the past few days. Based on the close on November 21, a MACD histogram lower than -1.15 would be needed before a histochastic short entry would be created. In any event, the initial target to the downside would probably be at the 23.6% Fibonacci level or approximately $3.54, with the next downside target being the 38.2% Fibonacci level near $3.33. |
Technical Writer for Technical Analysis of STOCKS & COMMODITIES magazine, Working-Money.com, and Traders.com Advantage.
| Title: | Technical Writer |
| Company: | Technical Analysis, Inc. |
| Address: | 4757 California Avenue SW |
| Seattle, WA 98116 | |
| Phone # for sales: | 206 938 0570 |
| Fax: | 206 938 1307 |
| Website: | www.Traders.com |
| E-mail address: | DPenn@traders.com |
Traders' Resource Links | |
| Charting the Stock Market: The Wyckoff Method -- Books | |
| Working-Money.com -- Online Trading Services | |
| Traders.com Advantage -- Online Trading Services | |
| Technical Analysis of Stocks & Commodities -- Publications and Newsletters | |
| Working Money, at Working-Money.com -- Publications and Newsletters | |
| Traders.com Advantage -- Publications and Newsletters | |
| Professional Traders Starter Kit -- Software | |
Click here for more information about our publications!
Comments
Date: 11/25/06Rank: 2Comment:

Request Information From Our Sponsors
- StockCharts.com, Inc.
- Candle Patterns
- Candlestick Charting Explained
- Intermarket Technical Analysis
- John Murphy on Chart Analysis
- John Murphy's Chart Pattern Recognition
- John Murphy's Market Message
- MurphyExplainsMarketAnalysis-Intermarket Analysis
- MurphyExplainsMarketAnalysis-Visual Analysis
- StockCharts.com
- Technical Analysis of the Financial Markets
- The Visual Investor
- VectorVest, Inc.
- Executive Premier Workshop
- One-Day Options Course
- OptionsPro
- Retirement Income Workshop
- Sure-Fire Trading Systems (VectorVest, Inc.)
- Trading as a Business Workshop
- VectorVest 7 EOD
- VectorVest 7 RealTime/IntraDay
- VectorVest AutoTester
- VectorVest Educational Services
- VectorVest OnLine
- VectorVest Options Analyzer
- VectorVest ProGraphics v6.0
- VectorVest ProTrader 7
- VectorVest RealTime Derby Tool
- VectorVest Simulator
- VectorVest Variator
- VectorVest Watchdog
