

HOT TOPICS LIST
- MACD
- Fibonacci
- RSI
- Gann
- ADXR
- Stochastics
- Volume
- Triangles
- Futures
- Cycles
- Volatility
- ZIGZAG
- MESA
- Retracement
- Aroon
INDICATORS LIST
LIST OF TOPICS
PRINT THIS ARTICLE
by David Penn
Weekly directional movement points to more upside for homebuilding stocks.
Position: N/A
David Penn
Technical Writer for Technical Analysis of STOCKS & COMMODITIES magazine, Working-Money.com, and Traders.com Advantage.
PRINT THIS ARTICLE
REVERSAL
The Bounce In Homebuilding
11/21/06 02:42:16 PMby David Penn
Weekly directional movement points to more upside for homebuilding stocks.
Position: N/A
| In what has to be the clearest case of "been down so long it looks like up to me," homebuilding stocks have slowly put in intermediate-term bottoms and start to move higher. Conventional wisdom suggests that this is a case of stocks leading the market, meaning that while homebuilding stocks have been improving, the actual housing market itself is some six-odd months away from a turnaround. |

|
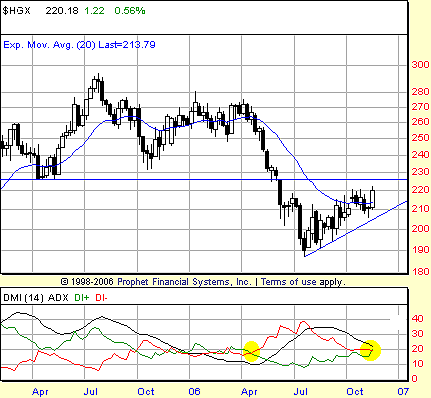
| FIGURE 1: $HGX. Not only did the homebuilding index slip below the 20-week exponential moving average in the spring of 2006, but the directional movement index revealed a rising bearish DI- line (in red) crossing above an otherwise bullish DI+ line (in green). |
| Graphic provided by: Prophet Financial, Inc. |
| |
| This is the "discounting" feature of stocks, which suggests that smart money is making a bet that these beaten-up homebuilding stocks will look a lot better six to nine months from now, when the actual housing market begins to turn around. I have no idea whether the housing market is experiencing a minor correction, a major correction, or something truly catastrophic. But it is increasingly clear that somebody (or somebodies) is increasingly banking on better times ahead for the builders. |
|
| FIGURE 2: PHILADELPHIA HOUSING SECTOR INDEX, WEEKLY. The break below the 20-week EMA comes just as the directional movement indicator provides a sell signal in the spring of 2006. The rightmost yellow oval highlights the beginning of a bullish cross of the DI+ line (in green) over the DI- line (in red). |
| Graphic provided by: Prophet Financial, Inc. |
| |
| Although topping out in July 2005, the bear market in homebuilding stocks did not truly get under way until the late spring of 2006. As Figure 1 shows, not only did the homebuilding index ($HGX) slip below the 20-week exponential moving average in the spring of 2006, but the directional movement indicator revealed a rising bearish DI- line (in red) crossing above an otherwise bullish DI+ line (in green). This helped provide confirmation for those looking to bet against the homebuilders that the trend had indeed reversed and that lower prices for these stocks were likely to arrive before higher prices would. |
|
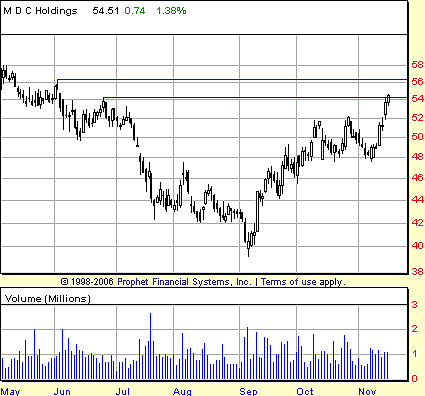
| FIGURE 3: MDC HOLDINGS, DAILY. After a consolidation in October, shares of MDC Holdings rocketed higher toward a zone of potential resistance in November. |
| Graphic provided by: Prophet Financial, Inc. |
| |
| This trend now appears about to reverse again, this time to the upside. As of Wednesday, November 15, there is another DI cross — this time, with the bullish DI+ crossing over the bearish DI-. Because this cross occurred midweek, traders will not know the extreme point with which to establish an entry level until Friday's close. But assuming the homebuilding stocks do not collapse over the balance of the week (negating the DI+ cross) or surge higher (raising the extreme point), traders can look for follow-through on the weekly DI+ cross the week beginning November 20. See Figure 2. |
| Among the individual homebuilding stocks, a number have well-constructed bases from which prices are just starting to emerge (RYL, MTH, LEN, KBH, BZH). A few others have already begun clear uptrends (MDC) on increasing volume (see Figure 3). While there was some interest in these stocks when they first began moving over the summer, attention to them was likely overwhelmed by strong performances in other areas, including semiconductors and retail in the summer and gold and oil early in the autumn. But traders would be wise to pay attention to the homebuilders over the next few months to see whether the follow-through to the upside shown thus far continues, bringing gains to those who were smart enough not to leave the housing stocks for dead. |
Technical Writer for Technical Analysis of STOCKS & COMMODITIES magazine, Working-Money.com, and Traders.com Advantage.
| Title: | Technical Writer |
| Company: | Technical Analysis, Inc. |
| Address: | 4757 California Avenue SW |
| Seattle, WA 98116 | |
| Phone # for sales: | 206 938 0570 |
| Fax: | 206 938 1307 |
| Website: | www.Traders.com |
| E-mail address: | DPenn@traders.com |
Traders' Resource Links | |
| Charting the Stock Market: The Wyckoff Method -- Books | |
| Working-Money.com -- Online Trading Services | |
| Traders.com Advantage -- Online Trading Services | |
| Technical Analysis of Stocks & Commodities -- Publications and Newsletters | |
| Working Money, at Working-Money.com -- Publications and Newsletters | |
| Traders.com Advantage -- Publications and Newsletters | |
| Professional Traders Starter Kit -- Software | |
Click here for more information about our publications!
Comments
Date:�11/21/06Rank:�3Comment:�

Request Information From Our Sponsors
- StockCharts.com, Inc.
- Candle Patterns
- Candlestick Charting Explained
- Intermarket Technical Analysis
- John Murphy on Chart Analysis
- John Murphy's Chart Pattern Recognition
- John Murphy's Market Message
- MurphyExplainsMarketAnalysis-Intermarket Analysis
- MurphyExplainsMarketAnalysis-Visual Analysis
- StockCharts.com
- Technical Analysis of the Financial Markets
- The Visual Investor
- VectorVest, Inc.
- Executive Premier Workshop
- One-Day Options Course
- OptionsPro
- Retirement Income Workshop
- Sure-Fire Trading Systems (VectorVest, Inc.)
- Trading as a Business Workshop
- VectorVest 7 EOD
- VectorVest 7 RealTime/IntraDay
- VectorVest AutoTester
- VectorVest Educational Services
- VectorVest OnLine
- VectorVest Options Analyzer
- VectorVest ProGraphics v6.0
- VectorVest ProTrader 7
- VectorVest RealTime Derby Tool
- VectorVest Simulator
- VectorVest Variator
- VectorVest Watchdog