HOT TOPICS LIST
- MACD
- Fibonacci
- RSI
- Gann
- ADXR
- Stochastics
- Volume
- Triangles
- Futures
- Cycles
- Volatility
- ZIGZAG
- MESA
- Retracement
- Aroon
INDICATORS LIST
LIST OF TOPICS
PRINT THIS ARTICLE
by Paolo Pezzutti
Using candlestick patterns and indicator divergences can help traders reinforce their assessment when trying to identify breakaway gaps.
Position: N/A
Paolo Pezzutti
Author of the book "Trading the US Markets - A Comprehensive Guide to US Markets for International Traders and Investors" - Harriman House (July 2008)
PRINT THIS ARTICLE
BREAKAWAY GAP
Breakaway Gaps At The Top: Selling Plays
11/21/06 09:46:52 AMby Paolo Pezzutti
Using candlestick patterns and indicator divergences can help traders reinforce their assessment when trying to identify breakaway gaps.
Position: N/A
| Many traders fear the opening gap and perceive it as a risk. Gaps, however, can be also an opportunity for profit. A gap day is one in which the low is higher than the previous day's high or the high is below the previous day's low. Prices change overnight when some new perception of the value of the financial instrument you are considering enters the marketplace. When markets are closed, events unfold that affect future value of assets. A gap down is printed when something makes owning the asset not desirable and the order imbalance opens the price well below the prior day's low. The opposite is true for an up gap. Understanding the implications of a gap makes its appearance at different points in a trend an opportunity to take advantage of what the gaps reveal and make a profit out of it. Traditionally, there are four types of gaps. The common gap occurs in a trading range and is not significant. The continuation gap occurs when a trend accelerates. During a trend, you may see a series of continuation gaps. The exhaustion gap occurs after an extended trend and it is soon followed by a trend reversal. Here I will focus on the breakaway gap that occurs when prices climb above a trading range, printing a gap, and the market breaks out into a new trend move. This type of gap, when identified correctly, provides an entry right at the beginning of a new trend and it is very profitable, as it allows the trader to let profits run while the trend develops. Of course, it is not so easy to spot a breakaway gap and the risk of failure is high. That is why you may want to reinforce the assessment of the gap using other tools. For example, you may want to use candlestick patterns. Candlestick signals, correlated with the appearance of gaps, provide valuable setups. Identifying candlestick sell signals prepares the investor for potential reversals. The doji at the top, dark clouds, hanging man, or bearish engulfing patterns are signals to be prepared for further down moves. The doji is a very good signal to witness a trend reversal. One indication is that at the top you observe one of these patterns, which is then followed by a down gap. To reinforce the indications even more, you may want to observe a divergence of some oscillator at the top, such as the moving average convergence/divergence (MACD) or the stochastic. In this way, you can reduce the risk associated to trade a potential reversal pattern. Let's see some examples. |

|
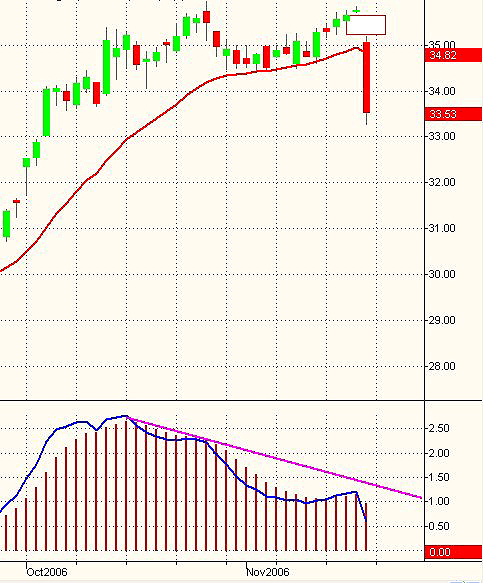
| FIGURE 1: WENDY'S INTERNATIONAL, DAILY. Last Friday the stock printed a down gap, indicating that prices in the short term could continue to the downside. |
| Graphic provided by: TradeStation. |
| |
| In Figure 1, you can see the daily chart of Wendy's International (WEN). After printing a top on October 26 in coincidence with a divergence of the MACD, the stock tried to retest the top. WEN developed higher closes characterized by a decreasing daily range. On November 16, it printed a double top on a doji candle. The next day it printed a down gap, which could be a breakaway gap, and a wide-ranging candle to the downside on news about the intention to buy back about 19% of its currently outstanding common shares. At this point, prices should continue lower in the short term. If prices close the gap, that would be considered a failure of the pattern, with prices likely accelerating toward the opposite direction. |

|
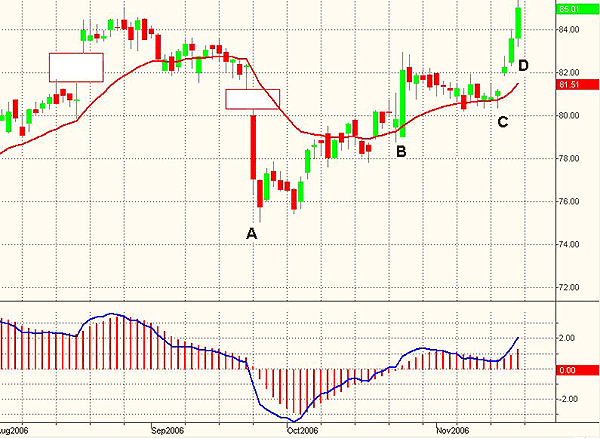
| FIGURE 2: ALTRIA, DAILY. After the down gap, prices moved up to close the gap and trap the bears. This chart presents a typical pattern failure. |
| Graphic provided by: TradeStation. |
| |
| In Figure 2, you can see a pattern failure. The daily chart of Altria Group (MO) developed a reversal island at the top, with the MACD displaying increased weakness. Several hanging man patterns were also printed during the distribution phase at the top. The big down gap followed by a wide-ranging day seemed to open a downtrend for the stock (point A) and represent a breakaway gap. Contrary to expectations, prices started to recover and closed the gap (point B) on an expansion day. After some time of consolidation, a continuation gap (point C) resumed the uptrend and last Friday prices printed a new high (point D). Contrarians here would note a turtle soup plus one setup for next Monday's session. |

|
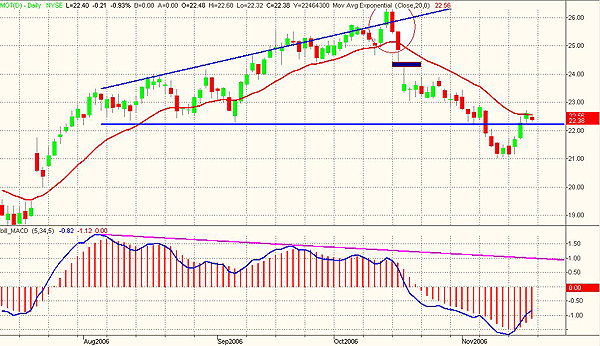
| FIGURE 3: MOTOROLA, DAILY. A bearish candlestick pattern at the top was confirmed by a breakaway down gap. |
| Graphic provided by: TradeStation. |
| |
| In Figure 3, you can see the daily chart of Motorola (MOT). The stock has developed a broadening formation. At each top, the MACD printed a negative divergence. On October 16, MOT printed a bearish candlestick formation confirmed by a breakaway down gap. In this case, prices continued to the downside and moved toward the support of the broadening formation. |

|
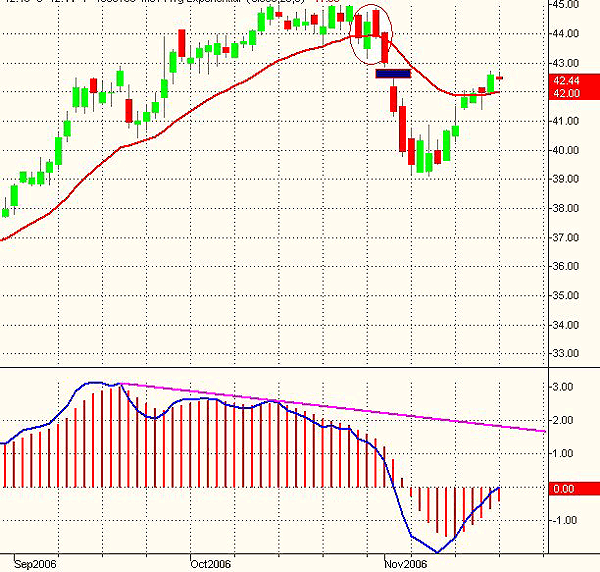
| FIGURE 4: FEDERATED DEPARTMENT STORES, DAILY. After the down gap, prices have continued the move for a few sessions before starting to reverse and test the gap closure level. |
| Graphic provided by: TradeStation. |
| |
| In Figure 4, you can see the daily chart of Federated Dept. Stores (FD). Here you can see the continued MACD negative divergences at the top and the bearish candlestick pattern printed before the breakaway gap. After the gap, prices continued to the downside, but they are now retesting the gap closure at the $44 level. This type of trade can be very profitable with increased directionality and volatility after the breakaway gap that opens the way to the newborn trend. Of course, there are no free meals when trading. Every trade presents risks of failure and you have to be aware of the possibility. In the examples, I have presented a pattern setup that could be traded the next day on WEN, a pattern failure (MO), a succesful formation (MOT), and finally a pattern that, depending on the exit rules adopted, could be profitable or not (FD). |
Author of the book "Trading the US Markets - A Comprehensive Guide to US Markets for International Traders and Investors" - Harriman House (July 2008)
| Address: | VIA ROBERTO AGO 26 POSTAL CODE 00166 |
| Rome, ITALY | |
| Phone # for sales: | +393357540708 |
| E-mail address: | pezzutti.paolo@tiscali.it |
Click here for more information about our publications!
Comments
Date: 11/21/06Rank: 3Comment:
Date: 11/24/06Rank: 5Comment:
Date: 11/28/06Rank: 5Comment:

Request Information From Our Sponsors
- StockCharts.com, Inc.
- Candle Patterns
- Candlestick Charting Explained
- Intermarket Technical Analysis
- John Murphy on Chart Analysis
- John Murphy's Chart Pattern Recognition
- John Murphy's Market Message
- MurphyExplainsMarketAnalysis-Intermarket Analysis
- MurphyExplainsMarketAnalysis-Visual Analysis
- StockCharts.com
- Technical Analysis of the Financial Markets
- The Visual Investor
- VectorVest, Inc.
- Executive Premier Workshop
- One-Day Options Course
- OptionsPro
- Retirement Income Workshop
- Sure-Fire Trading Systems (VectorVest, Inc.)
- Trading as a Business Workshop
- VectorVest 7 EOD
- VectorVest 7 RealTime/IntraDay
- VectorVest AutoTester
- VectorVest Educational Services
- VectorVest OnLine
- VectorVest Options Analyzer
- VectorVest ProGraphics v6.0
- VectorVest ProTrader 7
- VectorVest RealTime Derby Tool
- VectorVest Simulator
- VectorVest Variator
- VectorVest Watchdog
