HOT TOPICS LIST
- MACD
- Fibonacci
- RSI
- Gann
- ADXR
- Stochastics
- Volume
- Triangles
- Futures
- Cycles
- Volatility
- ZIGZAG
- MESA
- Retracement
- Aroon
INDICATORS LIST
LIST OF TOPICS
PRINT THIS ARTICLE
by David Penn
A classic chart pattern suggests more upside for the S&P 500 as the holiday season begins.
Position: N/A
David Penn
Technical Writer for Technical Analysis of STOCKS & COMMODITIES magazine, Working-Money.com, and Traders.com Advantage.
PRINT THIS ARTICLE
CUP WITH HANDLE
The S&P 500's Cup With Handle
11/21/06 02:13:22 PMby David Penn
A classic chart pattern suggests more upside for the S&P 500 as the holiday season begins.
Position: N/A
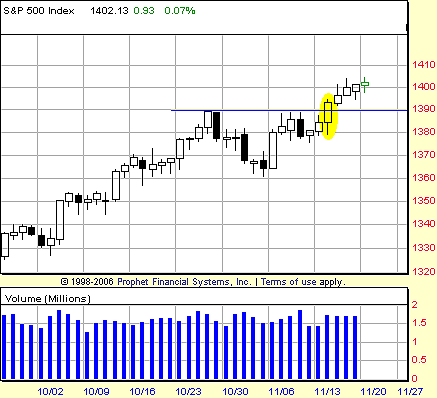
| For those looking for the great autumn stock market correction, I've got good news and bad news. The bad news: You probably missed it. The good news: The same as the bad news. The Standard & Poor's 500 has carved out a classic cup with handle pattern in the autumn of 2006. The pattern is short term, consisting of about 14 trading days. But it was well-timed enough to help tip the balance of Congress. And it may be powerful enough to send the S&P 500 even higher as the end of the year approaches. |

|
| FIGURE 1: STANDARD & POOR'S 500, DAILY. The cup with handle pattern in the S&P 500 projects to an upside of at least 1420, given a formation size of nearly 30 points and a breakout level of 1390. |
| Graphic provided by: Prophet Financial, Inc. |
| |
| The cup with handle pattern is one of the key patterns recognized by legendary stock trader and investor William O'Neil of How To Make Money In Stocks. This pattern was treated more extensively in the world of chart pattern expert Thomas Bulkowski, who wrote in his book Encyclopedia Of Chart Patterns about a number of conditions that traders should look for when trying to gauge the most profitable opportunities from among different cup with handle patterns (conditions such as "cups in a bull market" and "pick tall cups"). |
| Bulkowski's quantification of cup with handle patterns is pretty amazing work. Here, I take a much simpler tack, considering the late October–early November as a consolidation first, with a general cup with handle shape second. Essentially, most chart patterns are consolidations at root, and the method for projecting price moves once the market breaks free from the consolidation is often quite straightforward and similar, regardless of the specific type of consolidaton. In most cases, taking the width of the pattern/consolidation at its widest part and adding (for upside breakouts) or subtracting (for downside breakdowns) that amount from the top or bottom of the pattern/consolidation, respectively, provides traders and investors with a good sense of likely near-term price targets. |

|
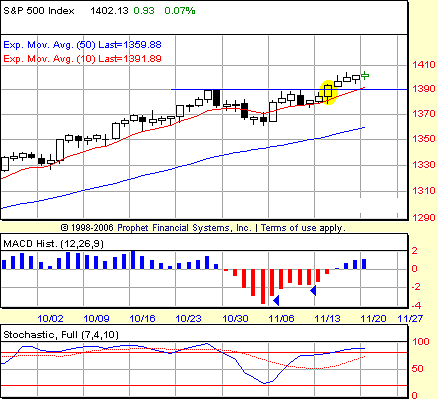
| FIGURE 2: S&P 500, DAILY. Two buy signals were generated during the cup with handle formation's development — one late in the formation of the cup and the other during the market's breakout from the handle. |
| Graphic provided by: Prophet Financial, Inc. |
| |
| How could traders have exploited this cup with handle? Figure 2 shows the histochastic screen (the moving average convergence/divergence [MACD] histogram and 7,10 stochastic) with the two blue arrows indicating days when buy signals were issued. Buy signals in the histochastic screen come in part from pullbacks in the MACD histogram. So when the histogram is, for example, at -2.99, then moves to -3.79, then to -3.00, a buy signal is created as of the close of the "-3.00" session — assuming all other bullish conditions are intact (such as the close being above a significant trendline or moving average). Those buy signals are November 6 and 10 would have been filled on November 14 (long entry target = range of signal day divided by two and added to the high of the signal day). |
| It will be worth watching to see how the market comes in during the short week of Thanksgiving. My suspicion is that this is an optimal time for some light profit-taking and jockeying for position for the bull run that is likely to take place between late November and the first half of December. |
Technical Writer for Technical Analysis of STOCKS & COMMODITIES magazine, Working-Money.com, and Traders.com Advantage.
| Title: | Technical Writer |
| Company: | Technical Analysis, Inc. |
| Address: | 4757 California Avenue SW |
| Seattle, WA 98116 | |
| Phone # for sales: | 206 938 0570 |
| Fax: | 206 938 1307 |
| Website: | www.Traders.com |
| E-mail address: | DPenn@traders.com |
Traders' Resource Links | |
| Charting the Stock Market: The Wyckoff Method -- Books | |
| Working-Money.com -- Online Trading Services | |
| Traders.com Advantage -- Online Trading Services | |
| Technical Analysis of Stocks & Commodities -- Publications and Newsletters | |
| Working Money, at Working-Money.com -- Publications and Newsletters | |
| Traders.com Advantage -- Publications and Newsletters | |
| Professional Traders Starter Kit -- Software | |
Click here for more information about our publications!
Comments
Date: 11/21/06Rank: 3Comment:
Date: 11/21/06Rank: 5Comment:
Date: 11/22/06Rank: 5Comment:

Request Information From Our Sponsors
- StockCharts.com, Inc.
- Candle Patterns
- Candlestick Charting Explained
- Intermarket Technical Analysis
- John Murphy on Chart Analysis
- John Murphy's Chart Pattern Recognition
- John Murphy's Market Message
- MurphyExplainsMarketAnalysis-Intermarket Analysis
- MurphyExplainsMarketAnalysis-Visual Analysis
- StockCharts.com
- Technical Analysis of the Financial Markets
- The Visual Investor
- VectorVest, Inc.
- Executive Premier Workshop
- One-Day Options Course
- OptionsPro
- Retirement Income Workshop
- Sure-Fire Trading Systems (VectorVest, Inc.)
- Trading as a Business Workshop
- VectorVest 7 EOD
- VectorVest 7 RealTime/IntraDay
- VectorVest AutoTester
- VectorVest Educational Services
- VectorVest OnLine
- VectorVest Options Analyzer
- VectorVest ProGraphics v6.0
- VectorVest ProTrader 7
- VectorVest RealTime Derby Tool
- VectorVest Simulator
- VectorVest Variator
- VectorVest Watchdog
