HOT TOPICS LIST
- MACD
- Fibonacci
- RSI
- Gann
- ADXR
- Stochastics
- Volume
- Triangles
- Futures
- Cycles
- Volatility
- ZIGZAG
- MESA
- Retracement
- Aroon
INDICATORS LIST
LIST OF TOPICS
PRINT THIS ARTICLE
by Arthur Hill
The 10-year Treasury note yield found support over the last two months but remains short of a reversal, and the odds favor a move lower for interest rates.
Position: Hold
Arthur Hill
Arthur Hill is currently editor of TDTrader.com, a website specializing in trading strategies, sector/industry specific breadth stats and overall technical analysis. He passed the Society of Technical Analysts (STA London) diploma exam with distinction is a Certified Financial Technician (CFTe). Prior to TD Trader, he was the Chief Technical Analyst for Stockcharts.com and the main contributor to the ChartSchool.
PRINT THIS ARTICLE
HEAD & SHOULDERS
Long-Term Rates Trending Lower
11/20/06 12:55:40 PMby Arthur Hill
The 10-year Treasury note yield found support over the last two months but remains short of a reversal, and the odds favor a move lower for interest rates.
Position: Hold
| The trend for the 10-year Treasury note yield ($TNX) is in place until proven otherwise. My goal is to establish the direction of the current trend and bet on a continuation until proven otherwise. First, I will show that the bulk of the evidence shows an existing downtrend. Second, I will show a bearish continuation pattern that would confirm this assumption. Third, I will show what it would take to reverse this downtrend. |
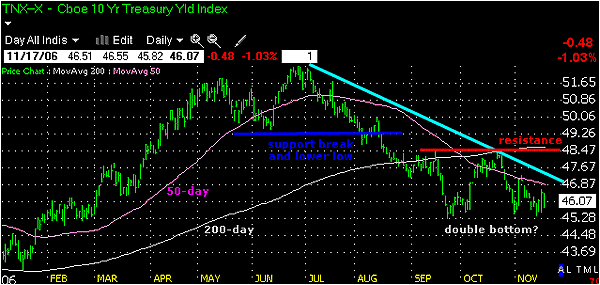
| On the price chart (Figure 1), the 10-year T-note yield broke below the June low, the 50-day moving average, and the 200-day moving average to establish a downtrend. You cannot have a downtrend without a lower low and this support break shows weakness. In addition, the 50-day moved below the 200-day in early October. The last crossover occurred in early October 2005 and the uptrend lasted around 12 months. This cross is less than two months old and could have further to run. |

|
| FIGURE 1: 10-YEAR TREASURY NOTE. The 10-year T-note broke below the June low, the 50-day moving average, and the 200-day moving average to establish a downtrend. |
| Graphic provided by: TC2000.com. |
| Graphic provided by: Telechart 2007. |
| |
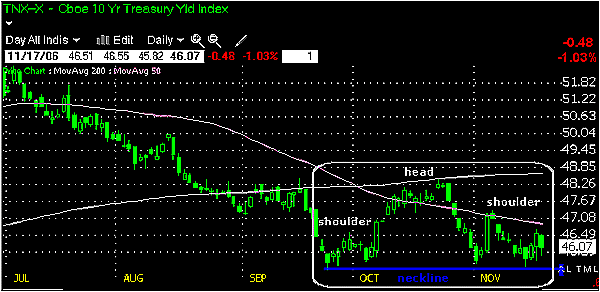
| $TNX established support around 45.40 (4.54%) over the last three months, and the pattern at work looks like a small head & shoulders of the continuation variety (Figure 2). The left shoulder formed in late September, the head in October, and the right shoulder in November. A move below 45.40 would signal a continuation lower and project further weakness to around 42.5. A decline in rates implies a rise in bonds and such a move would be bullish for bonds. |

|
| FIGURE 2: 10-YEAR TREASURY NOTE. The 10-year T-note appears to have formed a small head & shoulders pattern. |
| Graphic provided by: TC2000.com. |
| Graphic provided by: Telechart 2007. |
| |
| What would it take to prove this scenario otherwise and expect rates to rise? $TNX established resistance around 48.5 from the October high and the 200-day moving average. The 10-year T-note yield would have to hold support and break above 48.5 to reverse the current downtrend. The pattern at work would be a double bottom and the upside target would be to around 51.5 or a test of the May-July highs. |
Arthur Hill is currently editor of TDTrader.com, a website specializing in trading strategies, sector/industry specific breadth stats and overall technical analysis. He passed the Society of Technical Analysts (STA London) diploma exam with distinction is a Certified Financial Technician (CFTe). Prior to TD Trader, he was the Chief Technical Analyst for Stockcharts.com and the main contributor to the ChartSchool.
| Title: | Editor |
| Company: | TDTrader.com |
| Address: | Willem Geetsstraat 17 |
| Mechelen, B2800 | |
| Phone # for sales: | 3215345465 |
| Website: | www.tdtrader.com |
| E-mail address: | arthurh@tdtrader.com |
Traders' Resource Links | |
| TDTrader.com has not added any product or service information to TRADERS' RESOURCE. | |
Click here for more information about our publications!
Comments
Date: 11/21/06Rank: 4Comment:

|

Request Information From Our Sponsors
- StockCharts.com, Inc.
- Candle Patterns
- Candlestick Charting Explained
- Intermarket Technical Analysis
- John Murphy on Chart Analysis
- John Murphy's Chart Pattern Recognition
- John Murphy's Market Message
- MurphyExplainsMarketAnalysis-Intermarket Analysis
- MurphyExplainsMarketAnalysis-Visual Analysis
- StockCharts.com
- Technical Analysis of the Financial Markets
- The Visual Investor
- VectorVest, Inc.
- Executive Premier Workshop
- One-Day Options Course
- OptionsPro
- Retirement Income Workshop
- Sure-Fire Trading Systems (VectorVest, Inc.)
- Trading as a Business Workshop
- VectorVest 7 EOD
- VectorVest 7 RealTime/IntraDay
- VectorVest AutoTester
- VectorVest Educational Services
- VectorVest OnLine
- VectorVest Options Analyzer
- VectorVest ProGraphics v6.0
- VectorVest ProTrader 7
- VectorVest RealTime Derby Tool
- VectorVest Simulator
- VectorVest Variator
- VectorVest Watchdog
