

HOT TOPICS LIST
- MACD
- Fibonacci
- RSI
- Gann
- ADXR
- Stochastics
- Volume
- Triangles
- Futures
- Cycles
- Volatility
- ZIGZAG
- MESA
- Retracement
- Aroon
INDICATORS LIST
LIST OF TOPICS
PRINT THIS ARTICLE
by Koos van der Merwe
MGI Pharma focuses on oncology and acute care product acquisition, research, development, and commercialization. Why the downgrade?
Position: Accumulate
Koos van der Merwe
Has been a technical analyst since 1969, and has worked as a futures and options trader with First Financial Futures in Johannesburg, South Africa.
PRINT THIS ARTICLE
STOCHASTICS
Why The Downgrade On MGI Pharma?
11/17/06 12:39:02 PMby Koos van der Merwe
MGI Pharma focuses on oncology and acute care product acquisition, research, development, and commercialization. Why the downgrade?
Position: Accumulate
| MGI Pharma (MOGN) looks interesting. It has a good product base, and on July 17 the following companies reported as shown in Figure 1: |

|
| FIGURE 1: RESEARCH REPORTS. MGI Pharma was a biopharm company with a lot to look forward to. But then... |
| Graphic provided by: Yahoo Finance. |
| |
| So why the sudden drop on July 20, as shown in Figure 2? Why did these companies downgrade their forecasts? Was it because on July 19 they reported financial results for the period ended June 30, 2006, that was weaker than expected? |
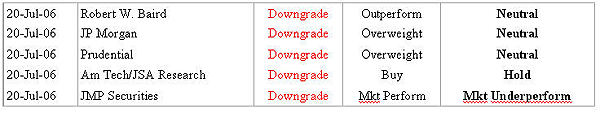
|
| FIGURE 2: RESEARCH REPORTS. What a difference a few days make! |
| Graphic provided by: Yahoo Finance. |
| |
| Figure 3 is a weekly chart and shows how the price moved from a low of $2.27 in August 2002 to a high of $33.81 by August 30, 2004. Not a bad return for two years. Since then the price has been falling steadily with very strong corrections as investors and analysts looked for a recovery. The weekly chart shows that at present levels, the price is once again testing the resistance line A-X , and the downgrade by Matrix Research on November 17 suggests that the stock price will fall once again to the support line, B-Y. |
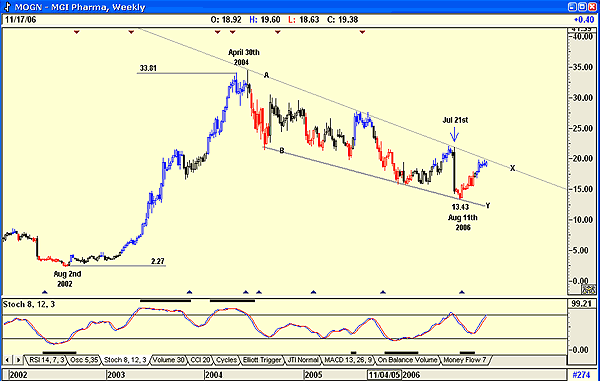
|
| FIGURE 3: MGI PHARMA, WEEKLY. MGI Pharma went up from $2.27 in August 2002 to a high of $33.81 by August 30, 2004. Not a bad return for two years. |
| Graphic provided by: AdvancedGET. |
| |
| November 17, 2006: Matrix Research. Downgrade- Hold-Strong Sell |
|
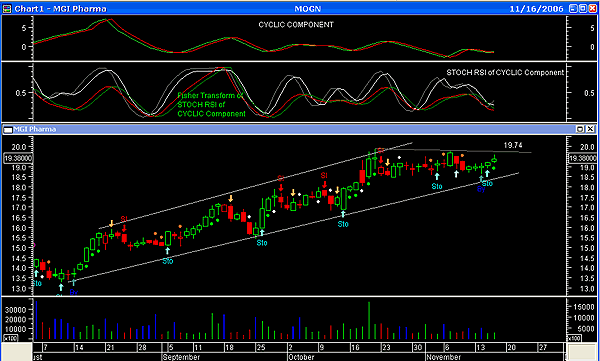
| FIGURE 4: MGI PHARMA, DAILY. Here's a chart showing buy/sell signals. |
| Graphic provided by: MetaStock. |
| |
| The stochastic indicator is also suggesting that the stock may be approaching overbought levels. If everything looks negative for the stock, then why has it appeared at the top of my exploration list in analyzing the market? For an answer, I look at my short-term trading chart. Figure 4 shows the two indicators that trigger the buy/sell signals on the chart. At the moment the chart is suggesting strength ... with two buy signals, one after the other. The green dot is an on-balance volume buy signal, confirming the stochastic relative strength index (RSI) signals. For the short term, in spite of a Matrix Research downgrade, the chart is suggesting a short-term buy. There is resistance at $19.74 as suggested by the resistance line, and we could wait to see if the line is penetrated before buying. Finally, do not forget that the weekly chart pattern could be suggesting a flag formation, which could see the price rising over time to above $60 ( 33.81 - 2.27 = 31.54 + 33.81 = $65.35). Definitely a share worth watching. |
Has been a technical analyst since 1969, and has worked as a futures and options trader with First Financial Futures in Johannesburg, South Africa.
| Address: | 3256 West 24th Ave |
| Vancouver, BC | |
| Phone # for sales: | 6042634214 |
| E-mail address: | petroosp@gmail.com |
Click here for more information about our publications!
Comments
Date:�11/17/06Rank:�3Comment:�

Request Information From Our Sponsors
- StockCharts.com, Inc.
- Candle Patterns
- Candlestick Charting Explained
- Intermarket Technical Analysis
- John Murphy on Chart Analysis
- John Murphy's Chart Pattern Recognition
- John Murphy's Market Message
- MurphyExplainsMarketAnalysis-Intermarket Analysis
- MurphyExplainsMarketAnalysis-Visual Analysis
- StockCharts.com
- Technical Analysis of the Financial Markets
- The Visual Investor
- VectorVest, Inc.
- Executive Premier Workshop
- One-Day Options Course
- OptionsPro
- Retirement Income Workshop
- Sure-Fire Trading Systems (VectorVest, Inc.)
- Trading as a Business Workshop
- VectorVest 7 EOD
- VectorVest 7 RealTime/IntraDay
- VectorVest AutoTester
- VectorVest Educational Services
- VectorVest OnLine
- VectorVest Options Analyzer
- VectorVest ProGraphics v6.0
- VectorVest ProTrader 7
- VectorVest RealTime Derby Tool
- VectorVest Simulator
- VectorVest Variator
- VectorVest Watchdog