

HOT TOPICS LIST
- MACD
- Fibonacci
- RSI
- Gann
- ADXR
- Stochastics
- Volume
- Triangles
- Futures
- Cycles
- Volatility
- ZIGZAG
- MESA
- Retracement
- Aroon
INDICATORS LIST
LIST OF TOPICS
PRINT THIS ARTICLE
by Dennis D. Peterson
The forecast oscillator uses linear regression to predict price and then compares the prediction to the actual price.
Position: N/A
Dennis D. Peterson
Market index trading on a daily basis.
PRINT THIS ARTICLE
LIN. REGTREND
Forecast Oscillator
10/19/00 03:10:26 PMby Dennis D. Peterson
The forecast oscillator uses linear regression to predict price and then compares the prediction to the actual price.
Position: N/A
| One technical analysis school of thought approaches price action in a statistical fashion.The market appears to behave in a random fashion and charts built using random number generators can have features that appear to be tops and bottoms and to some extent trends. If the market is truly random then a statistical approach would be an objective way to interpret price action. But some would argue that patterns such as head and shoulders are not a random event and have predictive value. |
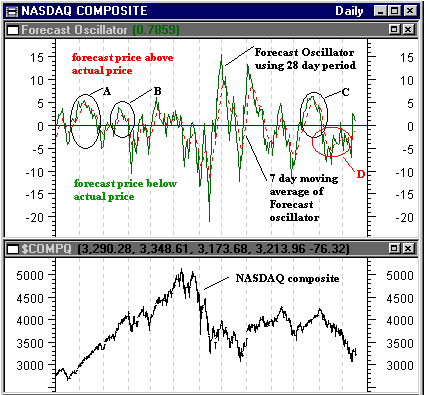
| The forecast oscillator attempts to predict upcoming price action by comparing the results of a linear regression trendline to the actual price for that day. Positive values of the oscillator occur when the forecast price is above the actual price and negative values when the forecast price is below. If prices are consistently below the forecast (positive oscillator values), then a downturn in prices is likely. Conversely, if prices are consistently above the forecast then an upturn in prices is likely. |
|
| Figure 1: Nasdaq versus the forecast oscillator. |
| Graphic provided by: MetaStock. |
| |
| I choose a 28-day period for the forecast oscillator to look at short to intermediate predictions. It is also typical to use a moving average of the oscillator, and in this case I am using a 7-day moving average to provide a degree of responsiveness. In cases A, B and C the oscillator gives a correct indication that prices are about to decline. The upturn in prices are a bit problematic. The decline of the Nasdaq in April was so strong and quick that, using the forecast oscillator, it was difficult to see when the Nasdaq was going to reverse. Case D is another problem area and unfortunately is our current Nasdaq state. Because stocks decline faster than they rise, the default may offer a solution. The default for the forecast oscillator is a five-day period and three days of smoothing. I tried using the default but found the whipsaw in signals unacceptable. |
| Whether the market is random or not can be argued, but statistical techniques do have a place in evaulating the significance of upcoming events. |
Market index trading on a daily basis.
| Title: | Staff Writer |
| Company: | Technical Analysis, Inc. |
| Address: | 4757 California Ave SW |
| Seattle, WA 98116-4499 | |
| Phone # for sales: | 206 938 0570 |
| Fax: | 206 938 1307 |
| Website: | www.traders.com |
| E-mail address: | dpeterson@traders.com |
Traders' Resource Links | |
| Charting the Stock Market: The Wyckoff Method -- Books | |
| Working-Money.com -- Online Trading Services | |
| Traders.com Advantage -- Online Trading Services | |
| Technical Analysis of Stocks & Commodities -- Publications and Newsletters | |
| Working Money, at Working-Money.com -- Publications and Newsletters | |
| Traders.com Advantage -- Publications and Newsletters | |
| Professional Traders Starter Kit -- Software | |
Click here for more information about our publications!
Comments

Request Information From Our Sponsors
- StockCharts.com, Inc.
- Candle Patterns
- Candlestick Charting Explained
- Intermarket Technical Analysis
- John Murphy on Chart Analysis
- John Murphy's Chart Pattern Recognition
- John Murphy's Market Message
- MurphyExplainsMarketAnalysis-Intermarket Analysis
- MurphyExplainsMarketAnalysis-Visual Analysis
- StockCharts.com
- Technical Analysis of the Financial Markets
- The Visual Investor
- VectorVest, Inc.
- Executive Premier Workshop
- One-Day Options Course
- OptionsPro
- Retirement Income Workshop
- Sure-Fire Trading Systems (VectorVest, Inc.)
- Trading as a Business Workshop
- VectorVest 7 EOD
- VectorVest 7 RealTime/IntraDay
- VectorVest AutoTester
- VectorVest Educational Services
- VectorVest OnLine
- VectorVest Options Analyzer
- VectorVest ProGraphics v6.0
- VectorVest ProTrader 7
- VectorVest RealTime Derby Tool
- VectorVest Simulator
- VectorVest Variator
- VectorVest Watchdog