HOT TOPICS LIST
- MACD
- Fibonacci
- RSI
- Gann
- ADXR
- Stochastics
- Volume
- Triangles
- Futures
- Cycles
- Volatility
- ZIGZAG
- MESA
- Retracement
- Aroon
INDICATORS LIST
LIST OF TOPICS
PRINT THIS ARTICLE
by David Penn
The much-anticipated breakout from a multimonth symmetrical triangle has arrived.
Position: N/A
David Penn
Technical Writer for Technical Analysis of STOCKS & COMMODITIES magazine, Working-Money.com, and Traders.com Advantage.
PRINT THIS ARTICLE
SYMMETRICAL TRIANGLE
Copper Cracks
11/15/06 11:06:01 AMby David Penn
The much-anticipated breakout from a multimonth symmetrical triangle has arrived.
Position: N/A
| Back in August, I tipped off Traders.com Advantage readers to developments in copper futures ("The Copper Triangle," August 25, 2006). In particular, I wanted to draw attention to the sizable, symmetrical triangle that copper had formed starting in May 2006. This triangle began to take form after a truly amazing rally in the metal, a rally that saw copper move from $2.20 in mid-March to approximately $3.90 by May. |

|
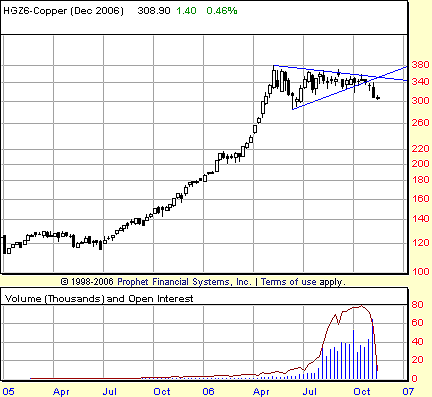
| FIGURE 1: DECEMBER COPPER, WEEKLY. The breakdown from this symmetrical triangle comes after an extended sideways correction. Nearest support is at the 2.20 level, from a consolidation earlier in the year. |
| Graphic provided by: Prophet Financial, Inc. |
| |
| Generally speaking, consolidations in trends tend to lead to more trend. So the most likely resolution of the symmetrical triangle that took shape in the middle of 2006 was to the upside, as the trend that led into the consolidation was restored upon leaving it. I offered no prediction with my August 2006 article on copper. I simply pointed out that an upside breakout would likely take copper futures to the $4.40 area, while a downside breakdown would probably see copper slipping toward the $2.40 mark. See Figure 1. |
| It appears as if the break that traders had been waiting for has finally arrived. In the first full week of November, December copper futures fell more than 20 cents on overwhelming volume to break down below the lower boundary of the symmetrical triangle that had contained virtually all price action in the contract since late spring. There is the possibility that the contract will find support at the lowest point of the triangle, a weekly hammer candlestick with lows at about 2.85. Such an event would invalidate the triangle, making the consolidation more of a garden-variety rectangular consolidation. On balance, however, the breakdown from the triangle looks clear cut and, arriving on large volume as it has, very much worth watching. |

|
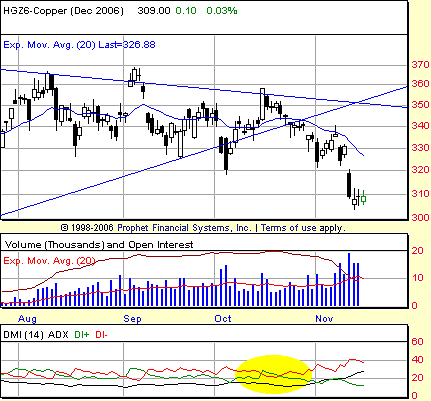
| FIGURE 2: DECEMBER COPPER, DAILY. The DMI provides a sell signal in late October, copper follows through to the downside after the DI- line (in red) crossed up over the DI+ line (in green). This sell signal was confirmed by the crossing of the ADX line (in black) up and over the green DI+ liine in early November. |
| Graphic provided by: Prophet Financial, Inc. |
| |
| How might traders have fared acting on this breakdown? The directional movement index/average directional movement index (DMI/ADX) in Figure 2 shows how some traders might have followed one path to profit. The DMI gave a sell signal on October 23 that would have been filled on October 24 using J. Welles Wilder's extreme point rule at approximately 3.40 (see my Working-Money.com article, "Trading DI+/-" from October 12, 2006, for more on the extreme point rule). An intraday high on October 26 of approximately 3.43 notwithstanding (the market closed that day at 3.40), this trade would have worked splendidly. In fact, by the time the ADX confirmed the DMI sell signal on November 2, December copper was trading near 3.29, some 11 cents and $2,750 in profit lower (each cent in copper futures is worth $250). |
| If the downside objective remains $2.40, then there should still be plenty of downside for traders to exploit. With the optimal DMI/ADX signal already passed, I find short entry targets using other screens such as the BOSO screen ("BOSO," Working-Money.com, October 5, 2005) and the histochastic screen, which uses shifts in the MACD histogram to trigger entries. Based on those two screens, there are short entries at 3.075 (BOSO) and 3.017 (histochastic) that might be levels to look for going forward. |
Technical Writer for Technical Analysis of STOCKS & COMMODITIES magazine, Working-Money.com, and Traders.com Advantage.
| Title: | Technical Writer |
| Company: | Technical Analysis, Inc. |
| Address: | 4757 California Avenue SW |
| Seattle, WA 98116 | |
| Phone # for sales: | 206 938 0570 |
| Fax: | 206 938 1307 |
| Website: | www.Traders.com |
| E-mail address: | DPenn@traders.com |
Traders' Resource Links | |
| Charting the Stock Market: The Wyckoff Method -- Books | |
| Working-Money.com -- Online Trading Services | |
| Traders.com Advantage -- Online Trading Services | |
| Technical Analysis of Stocks & Commodities -- Publications and Newsletters | |
| Working Money, at Working-Money.com -- Publications and Newsletters | |
| Traders.com Advantage -- Publications and Newsletters | |
| Professional Traders Starter Kit -- Software | |
Click here for more information about our publications!
Comments
Date: 11/15/06Rank: 3Comment:

Request Information From Our Sponsors
- StockCharts.com, Inc.
- Candle Patterns
- Candlestick Charting Explained
- Intermarket Technical Analysis
- John Murphy on Chart Analysis
- John Murphy's Chart Pattern Recognition
- John Murphy's Market Message
- MurphyExplainsMarketAnalysis-Intermarket Analysis
- MurphyExplainsMarketAnalysis-Visual Analysis
- StockCharts.com
- Technical Analysis of the Financial Markets
- The Visual Investor
- VectorVest, Inc.
- Executive Premier Workshop
- One-Day Options Course
- OptionsPro
- Retirement Income Workshop
- Sure-Fire Trading Systems (VectorVest, Inc.)
- Trading as a Business Workshop
- VectorVest 7 EOD
- VectorVest 7 RealTime/IntraDay
- VectorVest AutoTester
- VectorVest Educational Services
- VectorVest OnLine
- VectorVest Options Analyzer
- VectorVest ProGraphics v6.0
- VectorVest ProTrader 7
- VectorVest RealTime Derby Tool
- VectorVest Simulator
- VectorVest Variator
- VectorVest Watchdog
