HOT TOPICS LIST
- MACD
- Fibonacci
- RSI
- Gann
- ADXR
- Stochastics
- Volume
- Triangles
- Futures
- Cycles
- Volatility
- ZIGZAG
- MESA
- Retracement
- Aroon
INDICATORS LIST
LIST OF TOPICS
PRINT THIS ARTICLE
by David Penn
What happens when long-term bulls become short-term bears?
Position: N/A
David Penn
Technical Writer for Technical Analysis of STOCKS & COMMODITIES magazine, Working-Money.com, and Traders.com Advantage.
PRINT THIS ARTICLE
REVERSAL
Short-Term QQQQ Sell?
11/14/06 12:36:56 PMby David Penn
What happens when long-term bulls become short-term bears?
Position: N/A
| Few things are more disconcerting than being on the opposite side of someone you respect when it comes to a trading call. Recently, the stalled progress to the upside has apparently encouraged those who think that stock prices are likely to move seriously higher before they move seriously lower that there might be an opportunity to be had -- albeit in the short term -- from a bet against stocks. |

|
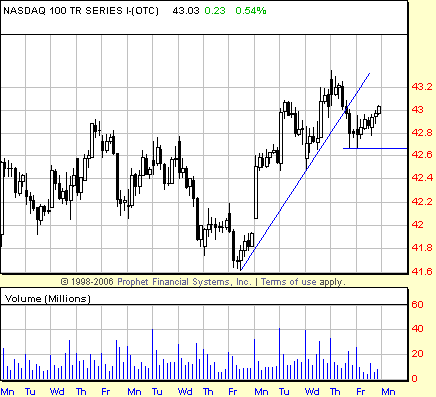
| FIGURE 1: NASDAQ 100 TRUST SERIES (QQQQ), HOURLY. The QQQQ have completed the first stage of a potential 1-2-3 trend reversal. The next stage will be an attempt to restore the trend that began on Friday, November 3, including a new high. |
| Graphic provided by: Prophet Financial, Inc. |
| |
| The short-term uptrend the QQQQs have enjoyed came courtesy of a fairly well-telegraphed bottom (see my "Is The End Near?" Traders.com Advantage, November 6, 2006). Positive divergences in the moving average convergence/divergence (MACD) and stochastic, a 2B bottom ... all of these factors came into play to put a bottom in the market in early November. See Figure 1. |
| So how does talk of a top play now? Looking at the same characteristics that made it possible to call the bottom in early November, I detect some of the same evidence that was so helpful in early November (namely, the positive divergences) coming into play as we move toward midmonth. Assuming that a short-term move to the downside should be noticeable on an hourly chart, it seems that the most bearish signs come from the break of the five-day uptrend from the November 3rd bottom. The trendline break was really a one-hour event as the QQQQ topped on Thursday and broke below the trendline later in the day. Almost immediately, however, the QQQQ rebounded -- albeit on weak volume -- and began moving higher, reaching the breakdown level by the close on Friday. This action sets up a potential 1-2-3 trend reversal, particularly if the QQQQ fails to set a new high and, instead, reverses and falls below the breakdown low at about 42.65 - 42.7. |

|
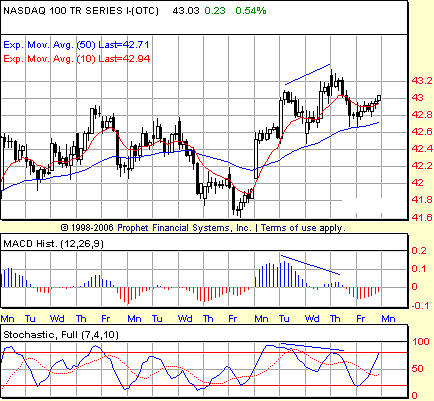
| FIGURE 2: NASDAQ 100 TRUST SERIES (QQQQ), HOURLY. Negative divergences appear in both the MACD histogram and stochastic. Divergences brought the market higher at the beginning of the month. Will divergences now bring the market down? |
| Graphic provided by: Prophet Financial, Inc. |
| |
| In addition to the 1-2-3 trend reversal setup, the hourly QQQQ reveals negative divergences on two levels: the MACD histogram and the stochastic (Figure 2). While these negative divergences are, in and of themselves, at least as apparent as the ones noted from the first three days of November, there is some reason to view the bearishness of these indicators with some degree of caution. With regard to the MACD histogram, for example, the size of the histogram peak on November 6 and 7 is strongly suggestive of a market that will take out the price highs that were concurrent with the peak. While those price highs were exceeded a few days later, the subsequent highs seem a little modest given the size of the early November histogram. |
| With regard to the stochastic, the late session rally on November 10 helped push the stochastic up, almost to the level of the previous stochastic peak. In fact, it wouldn't take very much buying at all on Monday to push the stochastic higher, making the only relevant negative divergence in the stochastic the one between the stochastic peak of November 1 - 3 and the one likely to develop the week beginning November 13. This would create a particularly odd sort of negative divergence -- odd, but one I've written about before (see my Working-Money.com article, "Dial 'D' For Divergences," March 8, 2006). This kind of divergence could be called the "diamond" divergence because of the way the peaks and troughs in the indicator mirror those in the market in question. In a negative diamond divergence we have three peaks with the higher peak in the center (like a head & shoulders pattern). At the same time, the indicator will form three peaks, with the center peak being the lowest of the three. That negative diamond divergence will be in effect as long as the third price peak does not take out the high set by the second price peak. Failing that, the bear case -- for the time being -- will be that much less potent. |
Technical Writer for Technical Analysis of STOCKS & COMMODITIES magazine, Working-Money.com, and Traders.com Advantage.
| Title: | Technical Writer |
| Company: | Technical Analysis, Inc. |
| Address: | 4757 California Avenue SW |
| Seattle, WA 98116 | |
| Phone # for sales: | 206 938 0570 |
| Fax: | 206 938 1307 |
| Website: | www.Traders.com |
| E-mail address: | DPenn@traders.com |
Traders' Resource Links | |
| Charting the Stock Market: The Wyckoff Method -- Books | |
| Working-Money.com -- Online Trading Services | |
| Traders.com Advantage -- Online Trading Services | |
| Technical Analysis of Stocks & Commodities -- Publications and Newsletters | |
| Working Money, at Working-Money.com -- Publications and Newsletters | |
| Traders.com Advantage -- Publications and Newsletters | |
| Professional Traders Starter Kit -- Software | |
Click here for more information about our publications!
Comments
Date: 11/14/06Rank: 3Comment:

|

Request Information From Our Sponsors
- StockCharts.com, Inc.
- Candle Patterns
- Candlestick Charting Explained
- Intermarket Technical Analysis
- John Murphy on Chart Analysis
- John Murphy's Chart Pattern Recognition
- John Murphy's Market Message
- MurphyExplainsMarketAnalysis-Intermarket Analysis
- MurphyExplainsMarketAnalysis-Visual Analysis
- StockCharts.com
- Technical Analysis of the Financial Markets
- The Visual Investor
- VectorVest, Inc.
- Executive Premier Workshop
- One-Day Options Course
- OptionsPro
- Retirement Income Workshop
- Sure-Fire Trading Systems (VectorVest, Inc.)
- Trading as a Business Workshop
- VectorVest 7 EOD
- VectorVest 7 RealTime/IntraDay
- VectorVest AutoTester
- VectorVest Educational Services
- VectorVest OnLine
- VectorVest Options Analyzer
- VectorVest ProGraphics v6.0
- VectorVest ProTrader 7
- VectorVest RealTime Derby Tool
- VectorVest Simulator
- VectorVest Variator
- VectorVest Watchdog
