HOT TOPICS LIST
- MACD
- Fibonacci
- RSI
- Gann
- ADXR
- Stochastics
- Volume
- Triangles
- Futures
- Cycles
- Volatility
- ZIGZAG
- MESA
- Retracement
- Aroon
INDICATORS LIST
LIST OF TOPICS
PRINT THIS ARTICLE
by Paolo Pezzutti
Renewable energy could benefit from the outcome of the elections and high energy prices.
Position: N/A
Paolo Pezzutti
Author of the book "Trading the US Markets - A Comprehensive Guide to US Markets for International Traders and Investors" - Harriman House (July 2008)
PRINT THIS ARTICLE
TECHNICAL ANALYSIS
PowerShares WilderHill Prints Positive MACD
11/13/06 10:18:46 AMby Paolo Pezzutti
Renewable energy could benefit from the outcome of the elections and high energy prices.
Position: N/A
| Renewable energy is created from sources that are constantly being renewed. The driving force of alternative energy is the scarcity of oil supply in the coming decades compared to the increasing global demand. Renewable energy exploits sources such as wind, solar, biogas, thermal, biomass, and others. With the US Democratic Party taking control of both the House and Senate, the political climate could be favorable to the industry related to environment. The political transition should be beneficial to the renewable energy sector, as the incoming Democrats will likely be interested in alternative energy. The hype about this sector could increase in case oil prices rise again toward all-time highs. |
| Investors who want to approach the renewable energy sector as a means to diversify their portfolio must face difficulties in order to identify the most promising companies. As a reference, investors can use: - The WilderHill Clean Energy Index (AMEX: ECO), which is composed of publicly traded companies whose business is based on the societal transition to the use of cleaner energy and conservation. - NASDAQ Clean Edge US Index (NASDAQ: CLEN), which tracks the performance of companies that manufacture, develop, distribute, and install clean-energy technologies. The PowerShares WilderHill Clean Energy Portfolio (PBW) is an ETF launched in February 2005. PBW focuses its investments on companies that support renewable and cleaner energy production and tracks the WilderHill Clean Energy Index. PBW has the majority of its assets invested in small-cap growth companies. Because of this and the limited number of holdings, investors can expect this fund to be volatile. |

|
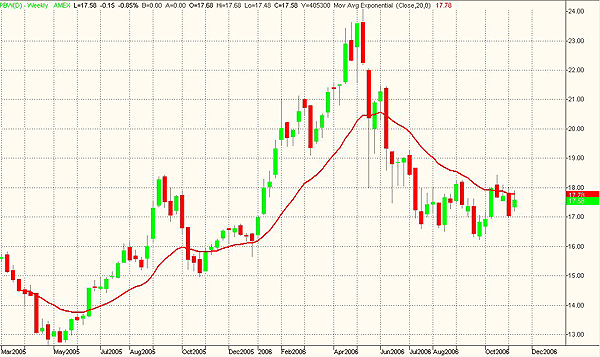
| FIGURE 1: PBW, WEEKLY. The fast downtrend brought prices toward the $16.50 support last July. The exchange traded fund (ETF) since then has been developing a sideways formation. |
| Graphic provided by: TradeStation. |
| |
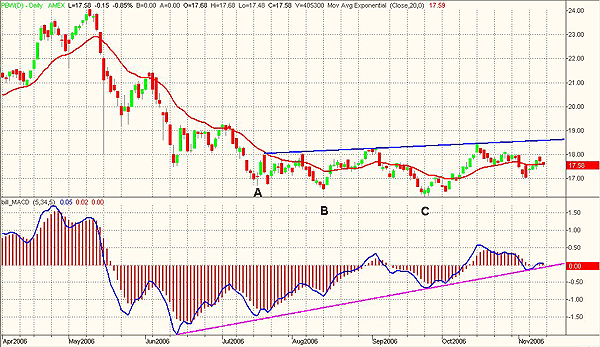
| PBW at the end of April 2005, right after being launched, printed a low of $12.65 (Figure 1). Since then, it has developed an uptrend that has brought prices to print a top of $24.08 at the beginning of May 2006, doubling its price in about a year. The May meltdown displays an impressive downturn to the September low of $16.24. The big swings are characteristic of a sector that is not mature yet, composed mainly of growth companies. Since last September, prices seem to have stabilized. In addition to that, the outcome of the elections could favor this sector some time in the future. Technically, it is interesting to observe that the moving average convergence/divergence (MACD) printed multiple positive divergences in coincidence with the lower lows at points A, B, and C indicated in Figure 2. The MACD calculates two exponential moving averages and their difference is plotted. This value is then averaged. You can see that MACD has been printing higher lows during the past months, but prices for the moment have not moved significantly to the upside. The ongoing sideways formation could be an accumulation phase. Prices have the potential to test at least the upper trendline displayed in the figure. |

|
| FIGURE 2: PBW, DAILY. The MACD has developed three consecutive positive divergences. |
| Graphic provided by: TradeStation. |
| |
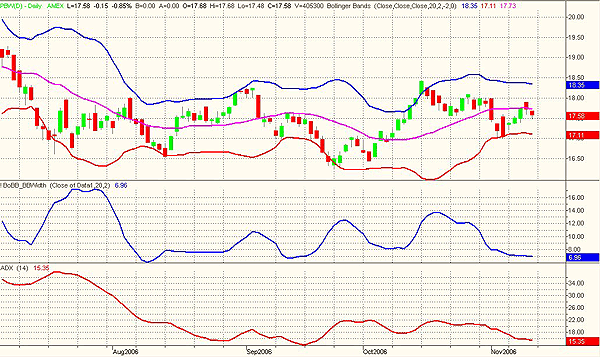
| In Figure 3 you can see that the average directional movement index (ADX), which measures the strength of an ongoing trend, is printing a low value of 15.35, confirming the present lack of a defined trend. The Bollinger Bandwidth indicator is calculated by subtracting the lower band from the upper band and then normalizing the result after you divide it by the middle band. The width of the bands is expressed as a percent of the moving average. Bandwidth, although it is still not printing extemely low levels, displays a situation of decreasing volatility. In fact, you can see the Bollinger Bands are perfectly flat and indicate the lack of a trend. Prices during the past months have been bouncing between the upper and the lower band without any directional impulse. |

|
| FIGURE 3: PBW, DAILY. The ETF is moving within a sideways formation. The ADX and the Bollinger Bandwidth indicator confirm the lack of directionality. |
| Graphic provided by: TradeStation. |
| |
| In this situation we may expect an increase in volatility and directionality to develop in the future. A trading option would be to trade a breakout of the sideways formation. The reason for this choice is that the sector has not followed the broader market in the recovery of the last May price levels. Should a general market correction develop, the sector could be particularly weak. A breakout of prices would confirm, the MACD produce positive divergences and it would reduce risk. |
Author of the book "Trading the US Markets - A Comprehensive Guide to US Markets for International Traders and Investors" - Harriman House (July 2008)
| Address: | VIA ROBERTO AGO 26 POSTAL CODE 00166 |
| Rome, ITALY | |
| Phone # for sales: | +393357540708 |
| E-mail address: | pezzutti.paolo@tiscali.it |
Click here for more information about our publications!
Comments
Date: 11/13/06Rank: 3Comment:
Date: 11/16/06Rank: 1Comment:

Request Information From Our Sponsors
- StockCharts.com, Inc.
- Candle Patterns
- Candlestick Charting Explained
- Intermarket Technical Analysis
- John Murphy on Chart Analysis
- John Murphy's Chart Pattern Recognition
- John Murphy's Market Message
- MurphyExplainsMarketAnalysis-Intermarket Analysis
- MurphyExplainsMarketAnalysis-Visual Analysis
- StockCharts.com
- Technical Analysis of the Financial Markets
- The Visual Investor
- VectorVest, Inc.
- Executive Premier Workshop
- One-Day Options Course
- OptionsPro
- Retirement Income Workshop
- Sure-Fire Trading Systems (VectorVest, Inc.)
- Trading as a Business Workshop
- VectorVest 7 EOD
- VectorVest 7 RealTime/IntraDay
- VectorVest AutoTester
- VectorVest Educational Services
- VectorVest OnLine
- VectorVest Options Analyzer
- VectorVest ProGraphics v6.0
- VectorVest ProTrader 7
- VectorVest RealTime Derby Tool
- VectorVest Simulator
- VectorVest Variator
- VectorVest Watchdog
