HOT TOPICS LIST
- MACD
- Fibonacci
- RSI
- Gann
- ADXR
- Stochastics
- Volume
- Triangles
- Futures
- Cycles
- Volatility
- ZIGZAG
- MESA
- Retracement
- Aroon
INDICATORS LIST
LIST OF TOPICS
PRINT THIS ARTICLE
by Arthur Hill
H&R Block gapped higher to form an island reversal that left the shorts stranded below the gap.
Position: Accumulate
Arthur Hill
Arthur Hill is currently editor of TDTrader.com, a website specializing in trading strategies, sector/industry specific breadth stats and overall technical analysis. He passed the Society of Technical Analysts (STA London) diploma exam with distinction is a Certified Financial Technician (CFTe). Prior to TD Trader, he was the Chief Technical Analyst for Stockcharts.com and the main contributor to the ChartSchool.
PRINT THIS ARTICLE
ISLAND REVERSAL
H&R Block Leaves Shorts Stranded
11/09/06 09:07:20 AMby Arthur Hill
H&R Block gapped higher to form an island reversal that left the shorts stranded below the gap.
Position: Accumulate
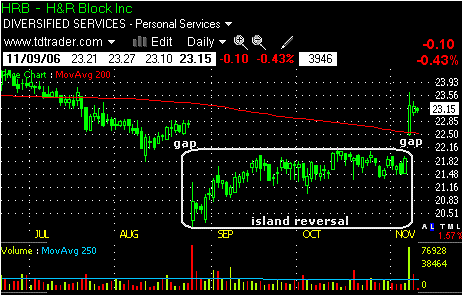
| The island reversal is a powerful formation that signals a change in sentiment and direction. H&R Block (HRB) gapped down in August and then traded flat the next few months (Figure 1). The gap held, and those with long positions were stuck with losses as the stock wallowed in the low 20s. To the bulls' credit, the stock firmed immediately after the gap and consolidated for more than two months. This showed lots of indecision, but no real confidence and sentiment was neutral at best. |

|
| FIGURE 1: H&R BLOCK, DAILY. HRB gapped down in August and then traded flat the next few months. |
| Graphic provided by: TC2000.com. |
| Graphic provided by: Telechart 2007. |
| |
| All that changed with a big gap on big volume. In one day, HRB filled the August gap and broke the 200-day moving average. As a result, there is a big blank space around 22 (no trades). The September–October consolidation represents the island and traders that established short positions on this island are now stuck with losses. Moreover, the ability to break the 200-day moving average indicates that a longer-term trend change is afoot. |

|
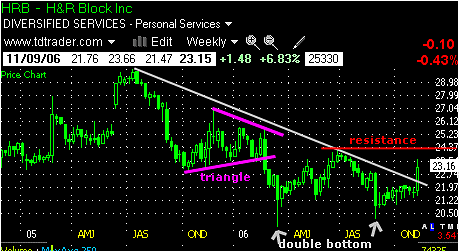
| FIGURE 2: H&R BLOCK, WEEKLY. It looks as though resistance is ahead in the mid-20s. |
| Graphic provided by: TC2000.com. |
| Graphic provided by: Telechart 2007. |
| |
| Despite the island reversal and gap on the daily chart, the weekly chart shows resistance just ahead in the mid-20s (Figure 2). This resistance zone stems from a triangle consolidation in early 2006, and this could give the bulls some trouble. Resistance is further confirmed at 24.3 from the June high. In fact, HRB has a double bottom working in 2006 with support at 20 and resistance at 24.3. A move above the June high would confirm the double bottom and project further strength toward the upper 20s. The gap and island reversal are a start. First, the gap must hold. Second, HRB needs to follow through with a resistance breakout to confirm the double bottom. |
Arthur Hill is currently editor of TDTrader.com, a website specializing in trading strategies, sector/industry specific breadth stats and overall technical analysis. He passed the Society of Technical Analysts (STA London) diploma exam with distinction is a Certified Financial Technician (CFTe). Prior to TD Trader, he was the Chief Technical Analyst for Stockcharts.com and the main contributor to the ChartSchool.
| Title: | Editor |
| Company: | TDTrader.com |
| Address: | Willem Geetsstraat 17 |
| Mechelen, B2800 | |
| Phone # for sales: | 3215345465 |
| Website: | www.tdtrader.com |
| E-mail address: | arthurh@tdtrader.com |
Traders' Resource Links | |
| TDTrader.com has not added any product or service information to TRADERS' RESOURCE. | |
Click here for more information about our publications!
Comments
Date: 11/10/06Rank: 4Comment:
Date: 11/12/06Rank: 5Comment: Based on the weekly chart, would you add shares now or wait until it breaks the resistance? And, if it breaks the resistance without volume support, then what?

Request Information From Our Sponsors
- StockCharts.com, Inc.
- Candle Patterns
- Candlestick Charting Explained
- Intermarket Technical Analysis
- John Murphy on Chart Analysis
- John Murphy's Chart Pattern Recognition
- John Murphy's Market Message
- MurphyExplainsMarketAnalysis-Intermarket Analysis
- MurphyExplainsMarketAnalysis-Visual Analysis
- StockCharts.com
- Technical Analysis of the Financial Markets
- The Visual Investor
- VectorVest, Inc.
- Executive Premier Workshop
- One-Day Options Course
- OptionsPro
- Retirement Income Workshop
- Sure-Fire Trading Systems (VectorVest, Inc.)
- Trading as a Business Workshop
- VectorVest 7 EOD
- VectorVest 7 RealTime/IntraDay
- VectorVest AutoTester
- VectorVest Educational Services
- VectorVest OnLine
- VectorVest Options Analyzer
- VectorVest ProGraphics v6.0
- VectorVest ProTrader 7
- VectorVest RealTime Derby Tool
- VectorVest Simulator
- VectorVest Variator
- VectorVest Watchdog
