HOT TOPICS LIST
- MACD
- Fibonacci
- RSI
- Gann
- ADXR
- Stochastics
- Volume
- Triangles
- Futures
- Cycles
- Volatility
- ZIGZAG
- MESA
- Retracement
- Aroon
INDICATORS LIST
LIST OF TOPICS
PRINT THIS ARTICLE
by Koos van der Merwe
This company was hit by the meltdown of 2000. Is it making a comeback now or is it a good trading opportunity?
Position: N/A
Koos van der Merwe
Has been a technical analyst since 1969, and has worked as a futures and options trader with First Financial Futures in Johannesburg, South Africa.
PRINT THIS ARTICLE
OSCILLATORS
Which Way For Tibco Software?
11/09/06 08:52:49 AMby Koos van der Merwe
This company was hit by the meltdown of 2000. Is it making a comeback now or is it a good trading opportunity?
Position: N/A
| Tibco Software (TIBX) is a leading provider of software solutions that enable businesses to integrate internal operations, business partners, and customer channels in real time. On November 6, the company announced it had been given a corporate award of excellence for 2006. At the same time, an Independent analyst group, Yphise, named the company's iProcess Suite as "Best Business Process Management Software Solution." Is this why the stock is recovering and has hit my "Watch me, Daddy" list? Let us look at the charts. |

|
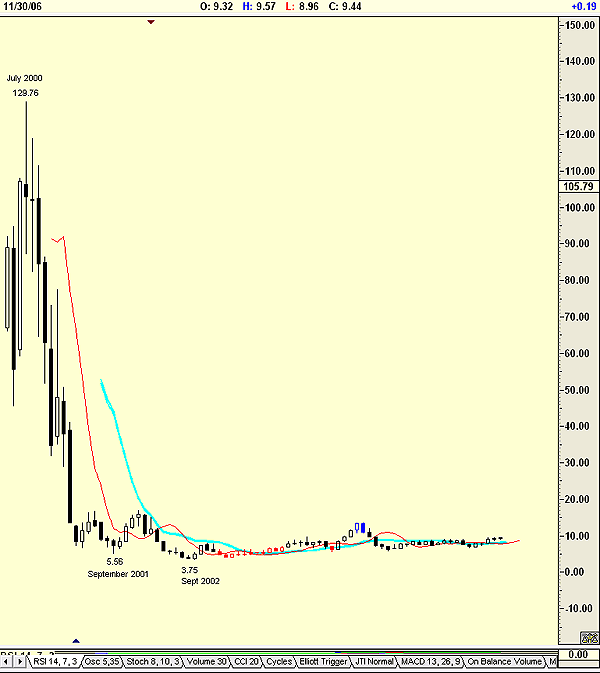
| FIGURE 1: TIBCO SOFTWARE, MONTHLY. The stock price dropped from a high of $129.76 in July 2000 to the low of $5.56 by September 2001, touching a low of $3.75 by September 2002. |
| Graphic provided by: AdvancedGET. |
| |
| Figure 1 is a monthly chart showing how the stock price fell from a high of $129.76 in July 2000 to the low of $5.56 by September 2001. The price touched a low of $3.75 by September 2002. |

|
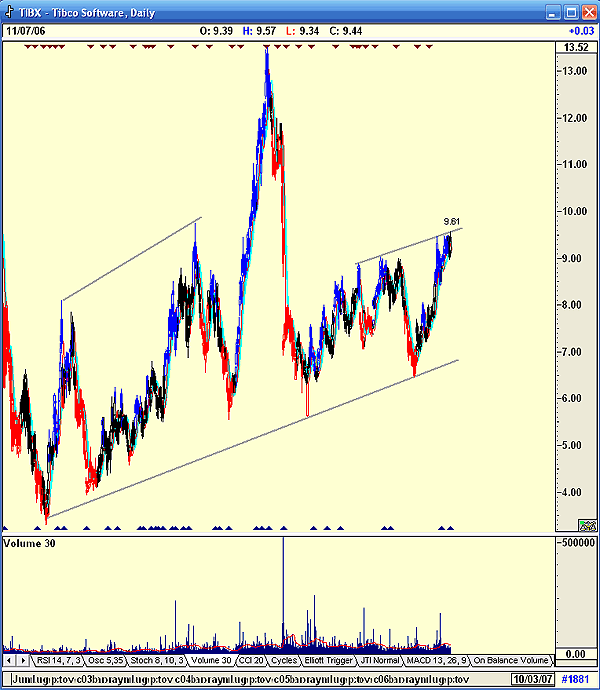
| FIGURE 2: TIBCO SOFTWARE, DAILY. This chart of TIBX shows volatility. |
| Graphic provided by: AdvancedGET. |
| |
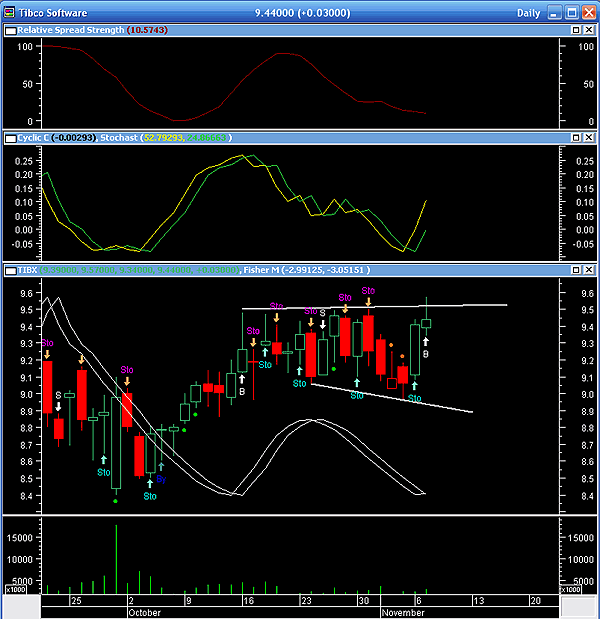
| Figure 2 is a daily chart that shows tremendous volatility and on good volume in the price. The stock price suggests a trader's dream, if said trader catches the moves with a sound trading strategy. To this end, I turn to my MetaStock charts shown in Figure 3, where I show the buy & sell arrows using the stochastic relative strength index (RSI) of the cyclic component. The indicator is suggesting a buy signal for the short term. I say "short term," because the resistance line in panel 2 at 9.61 could limit the rise of the price. Another negative — to me — is the large number of signals given recently, but that could be because the pattern formed is an open-ended "trumpet" with the upper line almost at the horizontal. The poor volume as the price rose is also a negative, and a deterrent. |

|
| FIGURE 3: TIBCO SOFTWARE, DAILY. This chart of TIBX shows trading signals. |
| Graphic provided by: MetaStock. |
| |
| The indicators shown are as follows: 1. The red line in the upper window is the relative strength spread, and this is approaching oversold levels. I use this indicator as a filter for my stochastic RSI. If the indicator is below 40, and the stochastic RSI has given a buy, then it will trigger. If the StchRSI gives a buy and the RSS is above 40, the StchRSI will not trigger. The inverse will occur with a sell, where my trigger is that the RSS must be above 70 to trigger a sell from the StchRSI. 2. My second window shows the StchRSI of the cyclic component. 3. The third window shows the stock price with the trendlines drawn in, showing the bad trumpet pattern that has formed. The window also shows the Fisher transform of a moving average convergence/divergence (MACD) of the price (white lines). This indicator is a lagging indicator, but gives strength to a buy/sell signal given by the stochastic RSI. Finally, the window shows buy & sell signals triggered by the Expert Advisor formula that I have written and continually revise as I discover newer and better-performing indicators in Technical Analysis of STOCKS & COMMODITIES. 4. The last window is the volume. Would I buy TIBX at the moment? No, I would rather wait for a move above the upper resistance line. I may lose a bit of profit should the price move up rapidly, but caution prevails. The stock, however, is on my watchlist. |
Has been a technical analyst since 1969, and has worked as a futures and options trader with First Financial Futures in Johannesburg, South Africa.
| Address: | 3256 West 24th Ave |
| Vancouver, BC | |
| Phone # for sales: | 6042634214 |
| E-mail address: | petroosp@gmail.com |
Click here for more information about our publications!
Comments
Date: 11/10/06Rank: 2Comment:

Request Information From Our Sponsors
- StockCharts.com, Inc.
- Candle Patterns
- Candlestick Charting Explained
- Intermarket Technical Analysis
- John Murphy on Chart Analysis
- John Murphy's Chart Pattern Recognition
- John Murphy's Market Message
- MurphyExplainsMarketAnalysis-Intermarket Analysis
- MurphyExplainsMarketAnalysis-Visual Analysis
- StockCharts.com
- Technical Analysis of the Financial Markets
- The Visual Investor
- VectorVest, Inc.
- Executive Premier Workshop
- One-Day Options Course
- OptionsPro
- Retirement Income Workshop
- Sure-Fire Trading Systems (VectorVest, Inc.)
- Trading as a Business Workshop
- VectorVest 7 EOD
- VectorVest 7 RealTime/IntraDay
- VectorVest AutoTester
- VectorVest Educational Services
- VectorVest OnLine
- VectorVest Options Analyzer
- VectorVest ProGraphics v6.0
- VectorVest ProTrader 7
- VectorVest RealTime Derby Tool
- VectorVest Simulator
- VectorVest Variator
- VectorVest Watchdog
