HOT TOPICS LIST
- MACD
- Fibonacci
- RSI
- Gann
- ADXR
- Stochastics
- Volume
- Triangles
- Futures
- Cycles
- Volatility
- ZIGZAG
- MESA
- Retracement
- Aroon
INDICATORS LIST
LIST OF TOPICS
PRINT THIS ARTICLE
by Koos van der Merwe
So far we have had a warm winter, and with a hurricane-free season, oil prices have been relatively low. But for how much longer?
Position: Buy
Koos van der Merwe
Has been a technical analyst since 1969, and has worked as a futures and options trader with First Financial Futures in Johannesburg, South Africa.
PRINT THIS ARTICLE
STOCHASTICS
Weatherford International Inc.
11/07/06 03:46:46 PMby Koos van der Merwe
So far we have had a warm winter, and with a hurricane-free season, oil prices have been relatively low. But for how much longer?
Position: Buy
| Weatherford International (WFT) is one of the world's leading providers of equipment and services used for the drilling, completion, and production of oil and natural gas wells. Its operations are conducted in numerous countries with service and sales locations in substantially all of the oil and natural gas producing regions in the world. |

|
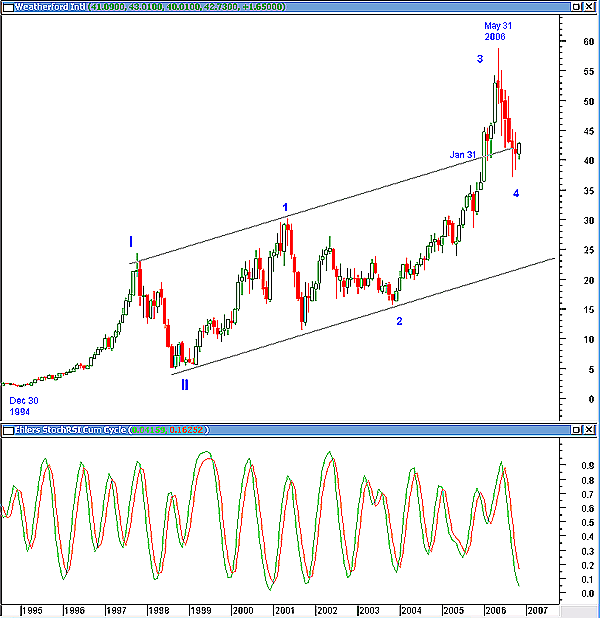
| FIGURE 1: WEATHERFORD INTERNATIONAL, MONTHLY. What's the outlook for this stock? |
| Graphic provided by: MetaStock. |
| |
| Figure 1 is a monthly chart that shows how the price moved from a low of $1.88 on December 30, 1994, to a high of $58.73 by May 31, 2006. The stock price broke through the upper resistance line on January 31, 2006, and in falling back, it appears to be looking for that trendline as a support level. The indicator — a stochastic RSI of the cumulative cycle — is suggesting that the price is oversold and could possibly, in the not-too-distant future, present a buy signal. A wave count is suggesting that the stock price has completed wave 4 of wave III. |

|
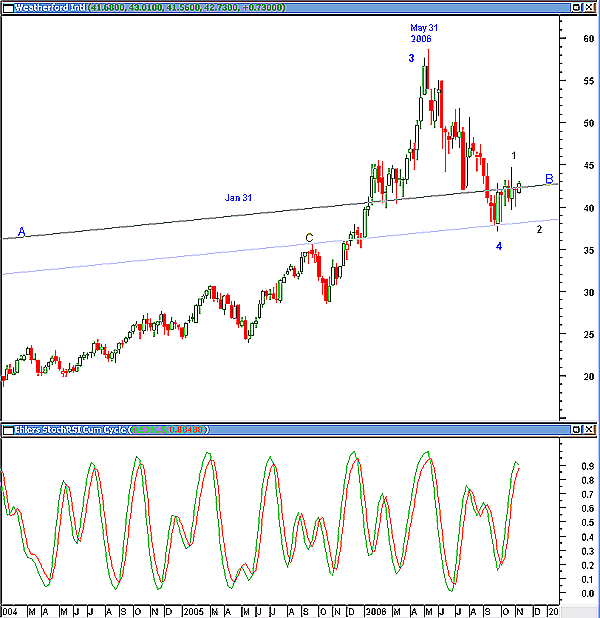
| FIGURE 2: WEATHERFORD INTERNATIONAL, WEEKLY. WFT is showing possible support level. |
| Graphic provided by: MetaStock. |
| |
| Figure 2, the weekly chart, tells a slightly different story. It shows how the resistance line A-B was penetrated to find support at a parallel line drawn from the pivot point at C. The indicator is suggesting that there is more downside to come, possibly a retest of the lower parallel line, in what could be waves 1 and 2 of wave 5 of wave III. |

|
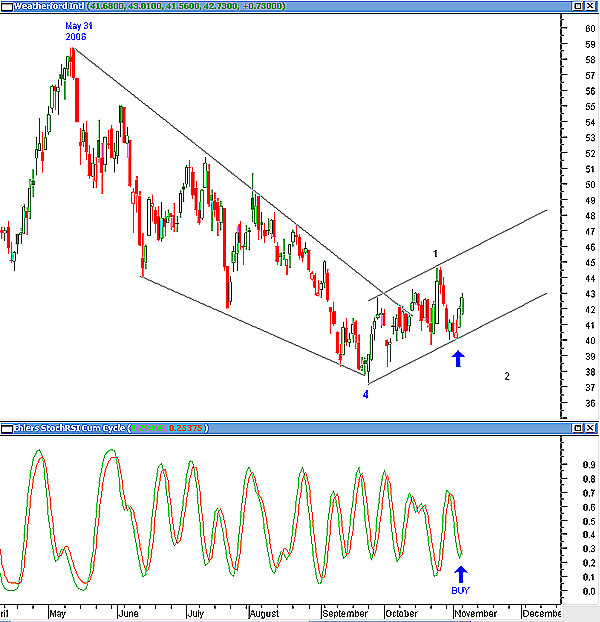
| FIGURE 3: WEATHERFORD INTERNATIONAL, DAILY. WFT is showing a short-term buy. |
| Graphic provided by: MetaStock. |
| |
| The daily chart (Figure 3), like the monthly chart, is suggesting strength and has given a short-term buy. Whether it will test the upper resistance line is debatable because, as the weekly chart suggests, wave 2 should be completed, and that means a move down penetrating the support line. The indicator is suggesting a buy at present levels. |
| To conclude, I would be a buyer of WFT at present levels. A short-term trader would sell when the indicator gives a sell signal, but the long-term investor would hold and add to their position as wave 2 finalizes itself. |
Has been a technical analyst since 1969, and has worked as a futures and options trader with First Financial Futures in Johannesburg, South Africa.
| Address: | 3256 West 24th Ave |
| Vancouver, BC | |
| Phone # for sales: | 6042634214 |
| E-mail address: | petroosp@gmail.com |
Click here for more information about our publications!
Comments
Date: 11/08/06Rank: 2Comment:

Request Information From Our Sponsors
- StockCharts.com, Inc.
- Candle Patterns
- Candlestick Charting Explained
- Intermarket Technical Analysis
- John Murphy on Chart Analysis
- John Murphy's Chart Pattern Recognition
- John Murphy's Market Message
- MurphyExplainsMarketAnalysis-Intermarket Analysis
- MurphyExplainsMarketAnalysis-Visual Analysis
- StockCharts.com
- Technical Analysis of the Financial Markets
- The Visual Investor
- VectorVest, Inc.
- Executive Premier Workshop
- One-Day Options Course
- OptionsPro
- Retirement Income Workshop
- Sure-Fire Trading Systems (VectorVest, Inc.)
- Trading as a Business Workshop
- VectorVest 7 EOD
- VectorVest 7 RealTime/IntraDay
- VectorVest AutoTester
- VectorVest Educational Services
- VectorVest OnLine
- VectorVest Options Analyzer
- VectorVest ProGraphics v6.0
- VectorVest ProTrader 7
- VectorVest RealTime Derby Tool
- VectorVest Simulator
- VectorVest Variator
- VectorVest Watchdog
