HOT TOPICS LIST
- MACD
- Fibonacci
- RSI
- Gann
- ADXR
- Stochastics
- Volume
- Triangles
- Futures
- Cycles
- Volatility
- ZIGZAG
- MESA
- Retracement
- Aroon
INDICATORS LIST
LIST OF TOPICS
PRINT THIS ARTICLE
by Dennis D. Peterson
Fifty two week new highs and new lows are a traditional breadth indicator to determine when a market has reached a new bottom or top.
Position: N/A
Dennis D. Peterson
Market index trading on a daily basis.
PRINT THIS ARTICLE
NEW HIGHS-NEW LOWS
Nasdaq New Highs and Lows
10/13/00 03:22:52 PMby Dennis D. Peterson
Fifty two week new highs and new lows are a traditional breadth indicator to determine when a market has reached a new bottom or top.
Position: N/A
| It has been recognized that when the number of new highs reaches an extreme value the market has a tendency to top. The same is true for an extreme in new lows. Recent action of the NASDAQ is similar to past action when the NASDAQ has reached a new top or bottom. |
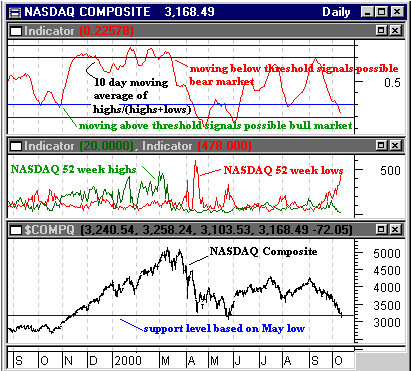
| It is difficult at best to predict when the Nasdaq will bottom out. Certainly as we break support lines the sellers are dominating. But the number of new highs and lows can reveal that the bottom has been reached. The number of stocks reaching new highs (Figure 1) typifies the bullishness of the market as seen in the rise of the Nasdaq in the last quarter of 1999. Similarly, when the number of new lows is increasing this is a signal that bearishness is increasing. |

|
| Figure 1: Nasdaq versus new highs and lows (middle chart) and the 10-Day moving average of highs/(highs+lows). |
| Graphic provided by: MetaStock. |
| |
| The change in the number of new highs and lows can be dramatic as seen from the peak in new highs in May to the peak in new lows in mid-April. One approach is to build an indicator of highs/(highs+lows), as suggested by Tim Hayes in the article "New Highs and New Lows" published "Technical Analysis of Stocks and Commodities", March 1996. Hayes suggests a 55 exponential moving average (EMA) of the ratio. I have used a 10-day moving average as a compromise to smooth the data and still not have an indicator that lags significantly. |
| To use the indicator look for a rise or fall in the average that passes through a threshold. Typically a pair of thresholds is built for each of the extremes. For a 10-day moving average I have constructed two pairs and am looking for the average to start to move up through the higher of the two lower thresholds. This is a signal that the bottom has been reached. In a similar fashion, when the average has moved down through the lower of the two high thresholds, a top is signalled. As you can see there still needs to be some analysis to come to the correct interpretation. Clearly the average was well on its way down prior to the Nasdaq decline in late March 2000. |
| Using this analogy, all we can say for now is that the Nasdaq is approaching a previous extreme in new lows. We are looking for an upturn in the moving average that crosses a threshold, providing reasonable assurance that the bottom has been reached. |
Market index trading on a daily basis.
| Title: | Staff Writer |
| Company: | Technical Analysis, Inc. |
| Address: | 4757 California Ave SW |
| Seattle, WA 98116-4499 | |
| Phone # for sales: | 206 938 0570 |
| Fax: | 206 938 1307 |
| Website: | www.traders.com |
| E-mail address: | dpeterson@traders.com |
Traders' Resource Links | |
| Charting the Stock Market: The Wyckoff Method -- Books | |
| Working-Money.com -- Online Trading Services | |
| Traders.com Advantage -- Online Trading Services | |
| Technical Analysis of Stocks & Commodities -- Publications and Newsletters | |
| Working Money, at Working-Money.com -- Publications and Newsletters | |
| Traders.com Advantage -- Publications and Newsletters | |
| Professional Traders Starter Kit -- Software | |
Click here for more information about our publications!
Comments
Date: / /Rank: 4Comment:
Date: / /Rank: 4Comment: I would appreciate being able to see this article charts updated on perhaps a weekly basis.

Request Information From Our Sponsors
- StockCharts.com, Inc.
- Candle Patterns
- Candlestick Charting Explained
- Intermarket Technical Analysis
- John Murphy on Chart Analysis
- John Murphy's Chart Pattern Recognition
- John Murphy's Market Message
- MurphyExplainsMarketAnalysis-Intermarket Analysis
- MurphyExplainsMarketAnalysis-Visual Analysis
- StockCharts.com
- Technical Analysis of the Financial Markets
- The Visual Investor
- VectorVest, Inc.
- Executive Premier Workshop
- One-Day Options Course
- OptionsPro
- Retirement Income Workshop
- Sure-Fire Trading Systems (VectorVest, Inc.)
- Trading as a Business Workshop
- VectorVest 7 EOD
- VectorVest 7 RealTime/IntraDay
- VectorVest AutoTester
- VectorVest Educational Services
- VectorVest OnLine
- VectorVest Options Analyzer
- VectorVest ProGraphics v6.0
- VectorVest ProTrader 7
- VectorVest RealTime Derby Tool
- VectorVest Simulator
- VectorVest Variator
- VectorVest Watchdog
