HOT TOPICS LIST
- MACD
- Fibonacci
- RSI
- Gann
- ADXR
- Stochastics
- Volume
- Triangles
- Futures
- Cycles
- Volatility
- ZIGZAG
- MESA
- Retracement
- Aroon
INDICATORS LIST
LIST OF TOPICS
PRINT THIS ARTICLE
by Paolo Pezzutti
The tick is a valuable tool, especially when utilized in a very short time frame, as it is quite effective at measuring market breadth. It is popular among daytraders and scalpers, as it can help assess the strength of market moves.
Position: N/A
Paolo Pezzutti
Author of the book "Trading the US Markets - A Comprehensive Guide to US Markets for International Traders and Investors" - Harriman House (July 2008)
PRINT THIS ARTICLE
TICK
A Tick Indicator Overview
11/06/06 02:28:03 PMby Paolo Pezzutti
The tick is a valuable tool, especially when utilized in a very short time frame, as it is quite effective at measuring market breadth. It is popular among daytraders and scalpers, as it can help assess the strength of market moves.
Position: N/A
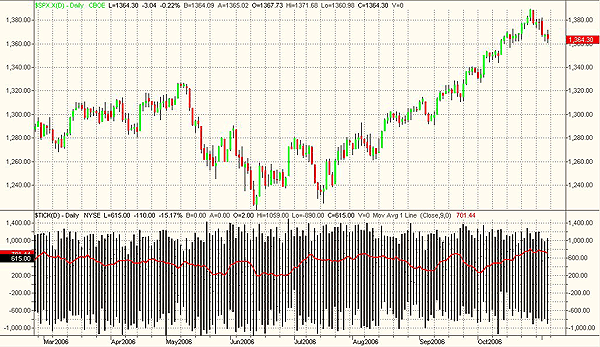
| The tick indicator measures the difference between the stocks listed on the New York Stock Exchange (NYSE) that print upticks versus the stocks that print downticks. You have the same type of indicator also for the Dow Jones Industrial Average stocks (TIKI) and the NASDAQ stocks (TIKQ). The tick is a breadth indicator that provides traders with an assessment of market strength or weakness, providing a comparison of the number of stocks advancing to stocks declining. It is a useful measure of very short-term sentiment because it captures the degree to which the broad market reflects the strength of bulls versus bears. Breadth is typically derived from some calculation that takes into account advancing/declining stocks and their volume. In addition to the tick, other similar indicators are the advance-decline line and the TRIN (also known as the Arms index). Typically, tick can be used to look for high/low readings to identify overbought/oversold points — difficult to say which values of reading represent oversold or overbought conditions. Authors present different numbers according to their studies or experience. During the past years characterized by an uptrend, the indicator has displayed a positive bias, so you will often see higher values indicated for overbought conditions (+1000 - +1200) than for oversold conditions (-800 - -1000). Should general market conditions change, obviously, you would note a negative bias. The tick can also be smoothed with a moving average to reduce noise. See Figure 1. |

|
| FIGURE 1: SPX, DAILY. The tick indicator displays a positive bias during the past three years' uptrend. As an example, you can see that the tick's 10-day moving average has always remained into positive territories during the past months. |
| Graphic provided by: TradeStation. |
| |
| Another way to use the tick is to spot divergences between the price and the indicator. A divergence occurs when price makes a new high (or low) but the tick makes a lower high (or higher low). The concept of nonconfirmation, which is valid for any indicator, here finds several good applications in short-term trading. Linda Bradford Raschke and Laurence Connors in their book Street Smarts, refer to it as a smart money indicator. They propose an interesting use of the tick indicator exploiting divergences between price and the indicator on the S&P Index futures. In particular, you have a buy signal when the S&P prints a low in the morning with a tick reading <350. The S&P then has to make a second lower or equal low at least 90 minutes later, which is not confirmed by the tick indicator. If the tick then improves by 100, that is the time to enter your long trade and apply a trailing stop to exit your trade. |
| There are many variations in the use of the tick indicator. Traders often use it associating its overbought and oversold conditions to bearish or bullish candlestick patterns, respectively, to spot short-term market reversal points. In the following examples, I will display how effective the indicator can be when used to spot short-term turning points associated to divergences. |

|
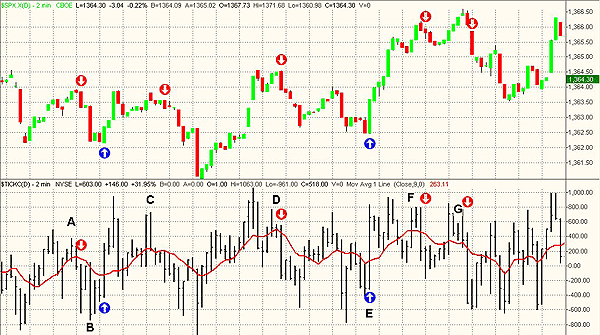
| FIGURE 2: SPX, TWO-MINUTE. The tick indicator can help traders spot very short-term reversal points. |
| Graphic provided by: TradeStation. |
| |
| In Figure 2, you can see how the tick indicator displayed some divergences efficiently, during last Friday's trading session of the S&P index. The chart shows a two-minute time frame. At point A, the tick indicator prints a negative divergence in coincidence with a relative high. A down candle associated with an expansion to the downside of the indicator provides a sell signal. A few bars later, at point B the index prints a double low and the tick indicator does not confirm price lows. An up candle associated to an expansion of the tick indicator provides a buy signal. At point C you can see another negative divergence of the indicator. The same occurs at point D, when a double top of prices is associated to a negative divergence of the tick indicator. A long down candle is associated to a long bar to the downside of tick. At point E you have a long up candle after a double low of price. A positive divergence and a breakout to the upside of the tick indicator provides a nice buy signal. At point F you can see an early sell signal that likely would end with a loss and at point G a good sell signal. The negative divergence is confirmed by a long down bar and an expansion of the tick indicator to the downside, indicating that in the very short term, prices would continue lower. |
Author of the book "Trading the US Markets - A Comprehensive Guide to US Markets for International Traders and Investors" - Harriman House (July 2008)
| Address: | VIA ROBERTO AGO 26 POSTAL CODE 00166 |
| Rome, ITALY | |
| Phone # for sales: | +393357540708 |
| E-mail address: | pezzutti.paolo@tiscali.it |
Click here for more information about our publications!
Comments
Date: 11/08/06Rank: 3Comment:

Request Information From Our Sponsors
- StockCharts.com, Inc.
- Candle Patterns
- Candlestick Charting Explained
- Intermarket Technical Analysis
- John Murphy on Chart Analysis
- John Murphy's Chart Pattern Recognition
- John Murphy's Market Message
- MurphyExplainsMarketAnalysis-Intermarket Analysis
- MurphyExplainsMarketAnalysis-Visual Analysis
- StockCharts.com
- Technical Analysis of the Financial Markets
- The Visual Investor
- VectorVest, Inc.
- Executive Premier Workshop
- One-Day Options Course
- OptionsPro
- Retirement Income Workshop
- Sure-Fire Trading Systems (VectorVest, Inc.)
- Trading as a Business Workshop
- VectorVest 7 EOD
- VectorVest 7 RealTime/IntraDay
- VectorVest AutoTester
- VectorVest Educational Services
- VectorVest OnLine
- VectorVest Options Analyzer
- VectorVest ProGraphics v6.0
- VectorVest ProTrader 7
- VectorVest RealTime Derby Tool
- VectorVest Simulator
- VectorVest Variator
- VectorVest Watchdog
