HOT TOPICS LIST
- MACD
- Fibonacci
- RSI
- Gann
- ADXR
- Stochastics
- Volume
- Triangles
- Futures
- Cycles
- Volatility
- ZIGZAG
- MESA
- Retracement
- Aroon
INDICATORS LIST
LIST OF TOPICS
PRINT THIS ARTICLE
by David Penn
The first positive divergence in the hourly chart of the QQQQ since the late October top offers hope for the bulls.
Position: N/A
David Penn
Technical Writer for Technical Analysis of STOCKS & COMMODITIES magazine, Working-Money.com, and Traders.com Advantage.
PRINT THIS ARTICLE
REVERSAL
Is The End Near?
11/06/06 09:31:02 AMby David Penn
The first positive divergence in the hourly chart of the QQQQ since the late October top offers hope for the bulls.
Position: N/A
| There may be no greater crime in market analysis than to start anticipating the end of a correction shortly after it has begun. Such behavior is usually the folly of perma-bulls who grudgingly acknowledge the reality of corrections by heralding their conclusion as soon as possible. But the fact is, corrections do run their course, and the course of corrections is no more inherently favorable to the bullish cause that might prefer short, shallow corrections than it is to the bearish cause, for whom no correction is deep enough. |

|
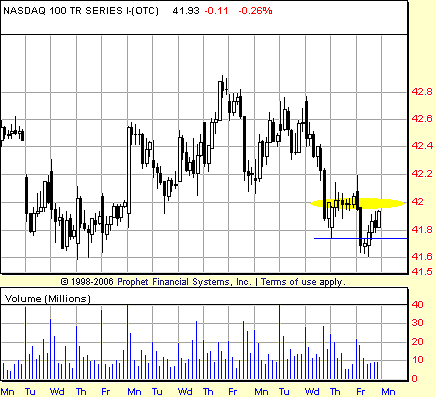
| FIGURE 1: NASDAQ 100 TRUST (QQQQ), HOURLY. The yellow oval represents the "buy zone" for a successful 2B test of bottom. A new low was created early in the Friday session, but the session failed to produce much follow-through to the downside. Should the QQQQ rally above the high of the previous low from early in the Thursday session, many short-side traders likely will be squeezed out of their bets against the market. |
| Graphic provided by: Prophet Financial, Inc. |
| |
| It is with all that in mind that I come to the correction in the NASDAQ 100 or, more specifically, the QQQQ. This correction comes at an interesting juncture (Figure 1). Many market watchers are desperate for a typically catastrophic October–November decline, particularly in this moment two years out from a Presidential election (a moment that historically been an optimal moment to buy, as I pointed out in a Working-Money.com article, "Midterm Miracles," August 8, 2006). Speaking of elections, there is a mid-term Congressional election that has many in the punditocracy wondering whether a win by the Democrats will have adverse (read: bearish) implications for the stock market. From a social mood perspective, a deep or prolonged correction at this point would hint at the sort of dissatisfaction that would result in a victory for political challengers, while a milder correction (or none at all) would have suggested a level of complacency or optimism that would allow for gains for the political incumbency. |
| So what do the charts themselves say? As far as the QQQQ is concerned, some of the more interesting clues about near-term direction can be found in the hourly charts. For example, over the span of two days, the hourly QQQQ chart has developed a 2B bottom with its most recent low. Although only of short-term duration, the 2B bottom in early November is the first sign of a turn since the QQQQ began falling in late October. Figure 1 shows the 2B bottom: the initial low on Thursday, the lower low on Friday, and the failure to follow through to the downside over the balance of the Friday session. In order for this 2B bottom to be complete, however, the QQQQ must rally above the high of the initial low early in the Thursday session, approximately the 42 level. |

|
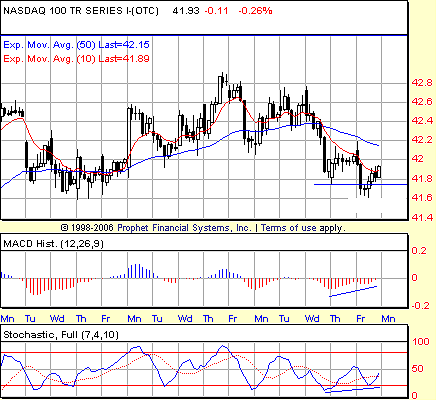
| FIGURE 2: NASDAQ 100 TRUST (QQQQ), HOURLY. Positive divergences in both the stochastic and the MACD histogram as a lower low is made during the Friday session suggest that a near-term bottom has been put in place. |
| Graphic provided by: Prophet Financial, Inc. |
| |
| When working with 2B bottoms, some of the best confirming evidence can be found in indicators like the stochastic and the moving average convergence/divergence (MACD) histogram, as well as other oscillators like the commodity channel index (CCI), the relative strength index (RSI), momentum, and so on. In the same sort of way that the 2B bottom shows us an instance in which the second low is "less bearish" because there is no follow-through to the downside, positive divergences in oscillators also show the second low as "less bearish" by registering a higher value compared to the first, initial low. This is the way in which oscillators can confirm 2B bottoms and make it all the more likely that the market that has developed a 2B bottom will, in fact, experience a reversal of some sort. See Figure 2. |
| Thus, the appearance of positive divergences in both the stochastic and the MACD histogram is a development that traders should be wary of — and prepared for. Whether these short-term bullish signs are valuable buying "clues" for traders trying to position themselves over longer time frames is hard to tell. If anything, these divergences suggest that shorts will be looking to cover soon. The question is whether short-covering can power the QQQQ to a high-enough level that buyers looking for longer-term gains will feel confident about joining in. |
Technical Writer for Technical Analysis of STOCKS & COMMODITIES magazine, Working-Money.com, and Traders.com Advantage.
| Title: | Technical Writer |
| Company: | Technical Analysis, Inc. |
| Address: | 4757 California Avenue SW |
| Seattle, WA 98116 | |
| Phone # for sales: | 206 938 0570 |
| Fax: | 206 938 1307 |
| Website: | www.Traders.com |
| E-mail address: | DPenn@traders.com |
Traders' Resource Links | |
| Charting the Stock Market: The Wyckoff Method -- Books | |
| Working-Money.com -- Online Trading Services | |
| Traders.com Advantage -- Online Trading Services | |
| Technical Analysis of Stocks & Commodities -- Publications and Newsletters | |
| Working Money, at Working-Money.com -- Publications and Newsletters | |
| Traders.com Advantage -- Publications and Newsletters | |
| Professional Traders Starter Kit -- Software | |
Click here for more information about our publications!
Comments
Date: 11/06/06Rank: 3Comment:

Request Information From Our Sponsors
- StockCharts.com, Inc.
- Candle Patterns
- Candlestick Charting Explained
- Intermarket Technical Analysis
- John Murphy on Chart Analysis
- John Murphy's Chart Pattern Recognition
- John Murphy's Market Message
- MurphyExplainsMarketAnalysis-Intermarket Analysis
- MurphyExplainsMarketAnalysis-Visual Analysis
- StockCharts.com
- Technical Analysis of the Financial Markets
- The Visual Investor
- VectorVest, Inc.
- Executive Premier Workshop
- One-Day Options Course
- OptionsPro
- Retirement Income Workshop
- Sure-Fire Trading Systems (VectorVest, Inc.)
- Trading as a Business Workshop
- VectorVest 7 EOD
- VectorVest 7 RealTime/IntraDay
- VectorVest AutoTester
- VectorVest Educational Services
- VectorVest OnLine
- VectorVest Options Analyzer
- VectorVest ProGraphics v6.0
- VectorVest ProTrader 7
- VectorVest RealTime Derby Tool
- VectorVest Simulator
- VectorVest Variator
- VectorVest Watchdog
