HOT TOPICS LIST
- MACD
- Fibonacci
- RSI
- Gann
- ADXR
- Stochastics
- Volume
- Triangles
- Futures
- Cycles
- Volatility
- ZIGZAG
- MESA
- Retracement
- Aroon
INDICATORS LIST
LIST OF TOPICS
PRINT THIS ARTICLE
by Arthur Hill
The Dow Jones Industrial Average has corrected over the last three days, and this correction is nearing its make-or-break point.
Position: Hold
Arthur Hill
Arthur Hill is currently editor of TDTrader.com, a website specializing in trading strategies, sector/industry specific breadth stats and overall technical analysis. He passed the Society of Technical Analysts (STA London) diploma exam with distinction is a Certified Financial Technician (CFTe). Prior to TD Trader, he was the Chief Technical Analyst for Stockcharts.com and the main contributor to the ChartSchool.
PRINT THIS ARTICLE
FLAGS AND PENNANTS
Short-Term Moment Of Truth For The Dow
11/01/06 10:34:31 AMby Arthur Hill
The Dow Jones Industrial Average has corrected over the last three days, and this correction is nearing its make-or-break point.
Position: Hold
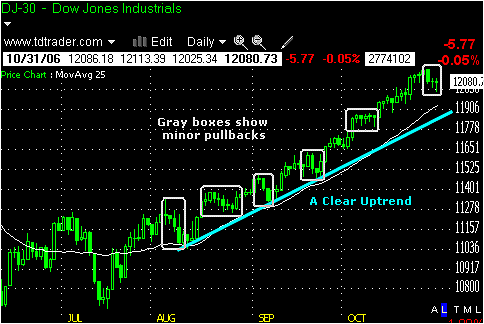
| The medium-term trend for the Dow Jones Industrial Average (DJIA) is clearly up (Figure 1). The average bottomed in mid-July and moved pretty much straight up for the next three and a half months. It was truly an amazing move, and the pullbacks lasted just a few days. The deepest pullback occurred in August, and each pullback since then has been quite shallow or simply flat. The current pullback lasted three days, with short-shallow pullbacks the norm since mid-August. |

|
| FIGURE 1: DJIA, DAILY. The Dow Jones Industrial Average bottomed in mid-July and since then has for the most part been moving up. |
| Graphic provided by: TC2000.com. |
| Graphic provided by: Telechart 2007. |
| |
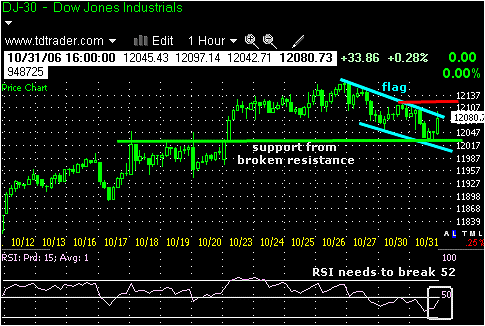
| I am turning to the 60-minute chart to focus on this pullback and short-term price action (Figure 2). The DJIA hit a new all-time high by moving above 12150 last week and then declined below 12050 this week. The decline looks like a falling flag and the average found support near broken resistance. This is all pretty normal for a minor correction. Broken resistance turns into support and the advance resumes without moving back below the resistance break. Broken resistance at 12030 is the first level to watch for signs of trouble. A break below 12025 would open the door to a deeper pullback that could extend to the August trendline on the daily chart. |

|
| FIGURE 2: DJIA, HOURLY. Broken resistance at 12030 is the first level to watch for signs of trouble. |
| Graphic provided by: TC2000.com. |
| Graphic provided by: Telechart 2007. |
| |
| As long as broken resistance holds, the decline back below 12050 is viewed as a correction within the ongoing uptrend. A break above the upper flag trendline and Monday's high would signal a continuation of this uptrend and target a move to new highs yet again. |
| I am also watching the relative strength index (RSI) to confirm a flag breakout. This momentum indicator declined below 50 on Friday and below 40 on Tuesday. Momentum is clearly moving down for the short term, and the RSI needs to break back above Monday's high (52) to turn short-term momentum bullish again. |
Arthur Hill is currently editor of TDTrader.com, a website specializing in trading strategies, sector/industry specific breadth stats and overall technical analysis. He passed the Society of Technical Analysts (STA London) diploma exam with distinction is a Certified Financial Technician (CFTe). Prior to TD Trader, he was the Chief Technical Analyst for Stockcharts.com and the main contributor to the ChartSchool.
| Title: | Editor |
| Company: | TDTrader.com |
| Address: | Willem Geetsstraat 17 |
| Mechelen, B2800 | |
| Phone # for sales: | 3215345465 |
| Website: | www.tdtrader.com |
| E-mail address: | arthurh@tdtrader.com |
Traders' Resource Links | |
| TDTrader.com has not added any product or service information to TRADERS' RESOURCE. | |
Click here for more information about our publications!
Comments
Date: 11/01/06Rank: 4Comment:
Date: 11/02/06Rank: 5Comment:

Request Information From Our Sponsors
- VectorVest, Inc.
- Executive Premier Workshop
- One-Day Options Course
- OptionsPro
- Retirement Income Workshop
- Sure-Fire Trading Systems (VectorVest, Inc.)
- Trading as a Business Workshop
- VectorVest 7 EOD
- VectorVest 7 RealTime/IntraDay
- VectorVest AutoTester
- VectorVest Educational Services
- VectorVest OnLine
- VectorVest Options Analyzer
- VectorVest ProGraphics v6.0
- VectorVest ProTrader 7
- VectorVest RealTime Derby Tool
- VectorVest Simulator
- VectorVest Variator
- VectorVest Watchdog
- StockCharts.com, Inc.
- Candle Patterns
- Candlestick Charting Explained
- Intermarket Technical Analysis
- John Murphy on Chart Analysis
- John Murphy's Chart Pattern Recognition
- John Murphy's Market Message
- MurphyExplainsMarketAnalysis-Intermarket Analysis
- MurphyExplainsMarketAnalysis-Visual Analysis
- StockCharts.com
- Technical Analysis of the Financial Markets
- The Visual Investor
