HOT TOPICS LIST
- MACD
- Fibonacci
- RSI
- Gann
- ADXR
- Stochastics
- Volume
- Triangles
- Futures
- Cycles
- Volatility
- ZIGZAG
- MESA
- Retracement
- Aroon
INDICATORS LIST
LIST OF TOPICS
PRINT THIS ARTICLE
by Gary Grosschadl
Falling from $58 to $22, will eBay become a hot seller again?
Position: Hold
Gary Grosschadl
Independent Canadian equities trader and technical analyst based in Peterborough
Ontario, Canada.
PRINT THIS ARTICLE
CHART ANALYSIS
eBay Inc. Faces Key Resistance
11/01/06 08:01:11 AMby Gary Grosschadl
Falling from $58 to $22, will eBay become a hot seller again?
Position: Hold
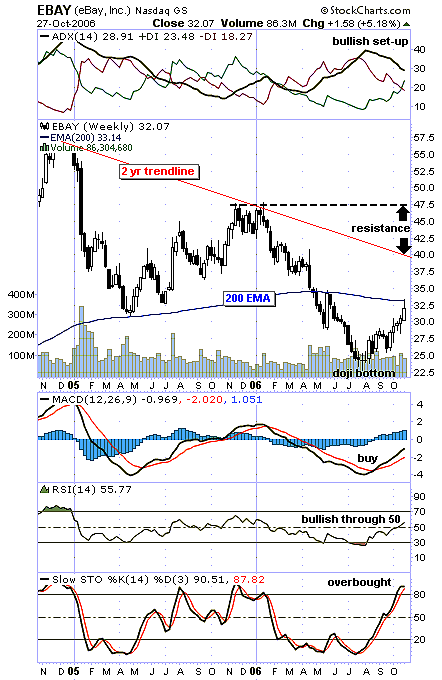
| Figure 1, a two-year weekly chart, shows a large decline from near $58 down to a support bounce off the 200-period exponential moving average (EMA) in April 2005. After another winter of investor discontent, the stock again hit a downleg, only this time 200-day EMA support did not hold. This led to a doji bottom last July. A doji candlestick (that is, a small cross indicating same open and close) often marks a strong reversal pattern after noteworthy uplegs or downlegs. |
| This current upleg since the doji bottom has now reached the first area of key resistance. The overhead 200-period EMA, currently at 33.14, is a high-profile area of resistance, often separating the bull and bear camps. Failure here could be interpreted as a bear rally, and then continued downside puts the stock in failure mode. Some consolidation at this point could be the precursor to the stock launching higher, with the 200-day EMA showing a switch to support. Should this bullish drive ensue, the next levels of key resistance are seen here as the two-year trendline near $40 and previous resistance at 47.50. |

|
| FIGURE 1: EBAY, INC., WEEKLY. This chart shows overhead resistance tests. |
| Graphic provided by: StockCharts.com. |
| |
| Several indicators are worth consideration. At the top of the chart, the DMI, or directional movement indicator, shows a bullish setup. The DMIs have crossed, signaling a switch from bearish to bullish sentiment. The next confirming bull signal here happens when the average directional movement index (ADX) ends up between both DIs and upslopes. |
| Below the chart, the moving average convergence/divergence (MACD) has flashed a buy signal with its crossover from low levels, while the relative strength index (RSI) shows bullish strength as it rises above the key 50 area. Meanwhile, the stochastic oscillator serves to remind us that this current move is now overbought and possibly due for some kind of consolidation or new downleg. |
| In summary, how this stock handles the overhead 200-day EMA will determine if the bulls push the stock upward to higher resistance or if the bears resume the downside slide or at least a possible double bottom. |
Independent Canadian equities trader and technical analyst based in Peterborough
Ontario, Canada.
| Website: | www.whatsonsale.ca/financial.html |
| E-mail address: | gwg7@sympatico.ca |
Click here for more information about our publications!
Comments
Date: 11/01/06Rank: 5Comment:

Request Information From Our Sponsors
- StockCharts.com, Inc.
- Candle Patterns
- Candlestick Charting Explained
- Intermarket Technical Analysis
- John Murphy on Chart Analysis
- John Murphy's Chart Pattern Recognition
- John Murphy's Market Message
- MurphyExplainsMarketAnalysis-Intermarket Analysis
- MurphyExplainsMarketAnalysis-Visual Analysis
- StockCharts.com
- Technical Analysis of the Financial Markets
- The Visual Investor
- VectorVest, Inc.
- Executive Premier Workshop
- One-Day Options Course
- OptionsPro
- Retirement Income Workshop
- Sure-Fire Trading Systems (VectorVest, Inc.)
- Trading as a Business Workshop
- VectorVest 7 EOD
- VectorVest 7 RealTime/IntraDay
- VectorVest AutoTester
- VectorVest Educational Services
- VectorVest OnLine
- VectorVest Options Analyzer
- VectorVest ProGraphics v6.0
- VectorVest ProTrader 7
- VectorVest RealTime Derby Tool
- VectorVest Simulator
- VectorVest Variator
- VectorVest Watchdog
