HOT TOPICS LIST
- MACD
- Fibonacci
- RSI
- Gann
- ADXR
- Stochastics
- Volume
- Triangles
- Futures
- Cycles
- Volatility
- ZIGZAG
- MESA
- Retracement
- Aroon
INDICATORS LIST
LIST OF TOPICS
PRINT THIS ARTICLE
by Arthur Hill
Borg Warner broke down on the daily chart, and this reversal paves the way for a bigger bearish reversal pattern on the weekly chart.
Position: Sell
Arthur Hill
Arthur Hill is currently editor of TDTrader.com, a website specializing in trading strategies, sector/industry specific breadth stats and overall technical analysis. He passed the Society of Technical Analysts (STA London) diploma exam with distinction is a Certified Financial Technician (CFTe). Prior to TD Trader, he was the Chief Technical Analyst for Stockcharts.com and the main contributor to the ChartSchool.
PRINT THIS ARTICLE
FALSE MOVES
Borg Warner Fails To Hold Breakout
10/31/06 08:29:36 AMby Arthur Hill
Borg Warner broke down on the daily chart, and this reversal paves the way for a bigger bearish reversal pattern on the weekly chart.
Position: Sell
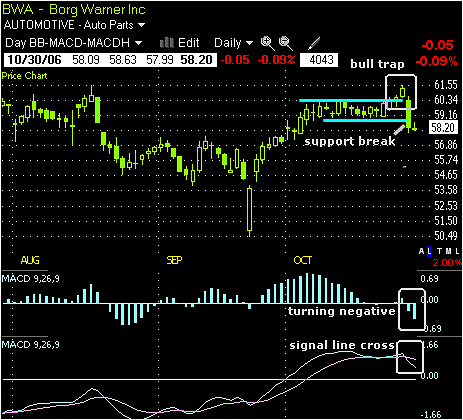
| On the daily chart (Figure 1), Borg Warner (BWA) broke consolidation resistance with a four-day surge and then gave it all back with a one-day fall. The bullish breakout was countered by a gap down and a long candlestick that broke below the consolidation low around 59. The failed breakout amounts to a bear trap, and the gap should be considered bearish as long as it holds. In addition, high volume validates the reversal and points to lower prices in the coming weeks. |

|
| FIGURE 1: BORG WARNER, DAILY. BWA broke consolidation resistance with a four-day surge and then gave it all back with a one-day fall. The failed breakout amounts to a bear trap, and the gap should be considered bearish as long as it holds. |
| Graphic provided by: TC2000.com. |
| Graphic provided by: Telechart 2007. |
| |
| The moving average convergence/divergence (MACD) moved below its signal line to turn momentum negative. The first indicator is the MACD histogram and the second is the MACD with its signal line. The MACD histogram measures the difference between MACD and its signal line. The histogram turns negative when MACD moves below its signal line. The MACD histogram turned negative over the last two days, and this is further evidence of a reversal. The MACD remains in positive territory, however, and would have to turn negative for the indicator to be considered fully bearish. |

|
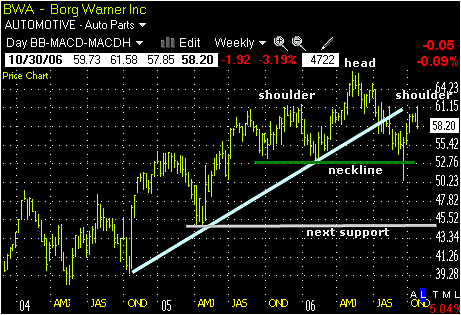
| FIGURE 2: BORG WARNER, WEEKLY. A head & shoulders reversal pattern is taking shape on this chart. |
| Graphic provided by: TC2000.com. |
| Graphic provided by: Telechart 2007. |
| |
| With a reaction high at 62 last week, a large head & shoulders reversal pattern is taking shape on the weekly chart (Figure 2). The left shoulder formed in November–December 2004 and the head formed in May 2006. Last week's reaction high at 62 is the start of the right shoulder, and neckline support resides around 53. I elected to draw through the spike low on September 22 because there was an immediate recovery. This appears to be a fluke, and I am using price action on either side of the spike for neckline support at 53. A break below 53 would confirm this pattern and project further weakness to the next support area around 45. |
Arthur Hill is currently editor of TDTrader.com, a website specializing in trading strategies, sector/industry specific breadth stats and overall technical analysis. He passed the Society of Technical Analysts (STA London) diploma exam with distinction is a Certified Financial Technician (CFTe). Prior to TD Trader, he was the Chief Technical Analyst for Stockcharts.com and the main contributor to the ChartSchool.
| Title: | Editor |
| Company: | TDTrader.com |
| Address: | Willem Geetsstraat 17 |
| Mechelen, B2800 | |
| Phone # for sales: | 3215345465 |
| Website: | www.tdtrader.com |
| E-mail address: | arthurh@tdtrader.com |
Traders' Resource Links | |
| TDTrader.com has not added any product or service information to TRADERS' RESOURCE. | |
Click here for more information about our publications!
Comments
Date: 10/31/06Rank: 4Comment:

|

Request Information From Our Sponsors
- StockCharts.com, Inc.
- Candle Patterns
- Candlestick Charting Explained
- Intermarket Technical Analysis
- John Murphy on Chart Analysis
- John Murphy's Chart Pattern Recognition
- John Murphy's Market Message
- MurphyExplainsMarketAnalysis-Intermarket Analysis
- MurphyExplainsMarketAnalysis-Visual Analysis
- StockCharts.com
- Technical Analysis of the Financial Markets
- The Visual Investor
- VectorVest, Inc.
- Executive Premier Workshop
- One-Day Options Course
- OptionsPro
- Retirement Income Workshop
- Sure-Fire Trading Systems (VectorVest, Inc.)
- Trading as a Business Workshop
- VectorVest 7 EOD
- VectorVest 7 RealTime/IntraDay
- VectorVest AutoTester
- VectorVest Educational Services
- VectorVest OnLine
- VectorVest Options Analyzer
- VectorVest ProGraphics v6.0
- VectorVest ProTrader 7
- VectorVest RealTime Derby Tool
- VectorVest Simulator
- VectorVest Variator
- VectorVest Watchdog
